Analysis services
Overview
Spectra Analyze supports optional integration with multiple first-party and third-party static and dynamic analysis services. Through these integrations, samples can be automatically submitted for dynamic analysis or reanalyzed on demand using any of the supported services.
All integrations work with samples submitted through the graphical user interface, as well as with those submitted via the Submissions API. Analysis results are organized by analysis type in the navigation bar on the left of the Sample Details Page.
First-party integrations are:
- ReversingLabs Cloud Sandbox for dynamic analysis.
- ReversingLabs Auxiliary Analysis for static analysis.
Third-party integrations are always used for dynamic analysis, and they are:
Integrations configuration
Analysis services must be configured on the Administration > Integrations & Connectors > Integrations page by an administrator. For more information, see Integrations.
Notes on configuration options
Submitting distinct files
Some analysis services have the option to submit only distinct files; however, it is disabled by default.
Administrators can enable this option to allow submitting only distinct files to an analysis service. When this option is enabled, if a file has already been submitted to Spectra Analyze and analyzed, it is not sent for reanalysis when it is submitted again. This option applies to files submitted using the GUI and the API. It does not affect the reanalysis feature - you can still submit files for reanalysis with any of the integrations even if the files have already been analyzed.
Queue limits and behavior
Some analysis services have queue limit for how many submissions can be simultaneously queued for analysis. Samples are considered queued if they are waiting for analysis or, in some cases, if they are in a processing state. If the queue is full, the appliance attempts to resubmit a sample up to five times, with a delay of 20 seconds between each attempt, before timing out. If it fails to resubmit the sample, that sample is removed from the queue.
Dynamic analysis
ReversingLabs Cloud Sandbox
For more information about configuring this integration, see ReversingLabs Cloud Sandbox.
Spectra Analyze is integrated with the ReversingLabs dynamic analysis API, providing historical information on all dynamic analyses performed on the detonated sample, with detected indicators of compromise available through Advanced Search using the uri-dynamic and ipv4-dynamic keywords, as well as through sections on the Sample Details Summary page.
For this service to be available, the appliance has to be connected to Spectra Intelligence.
If the service is enabled, historic dynamic analysis results are shown for all samples that have them.
Dynamic analysis reports
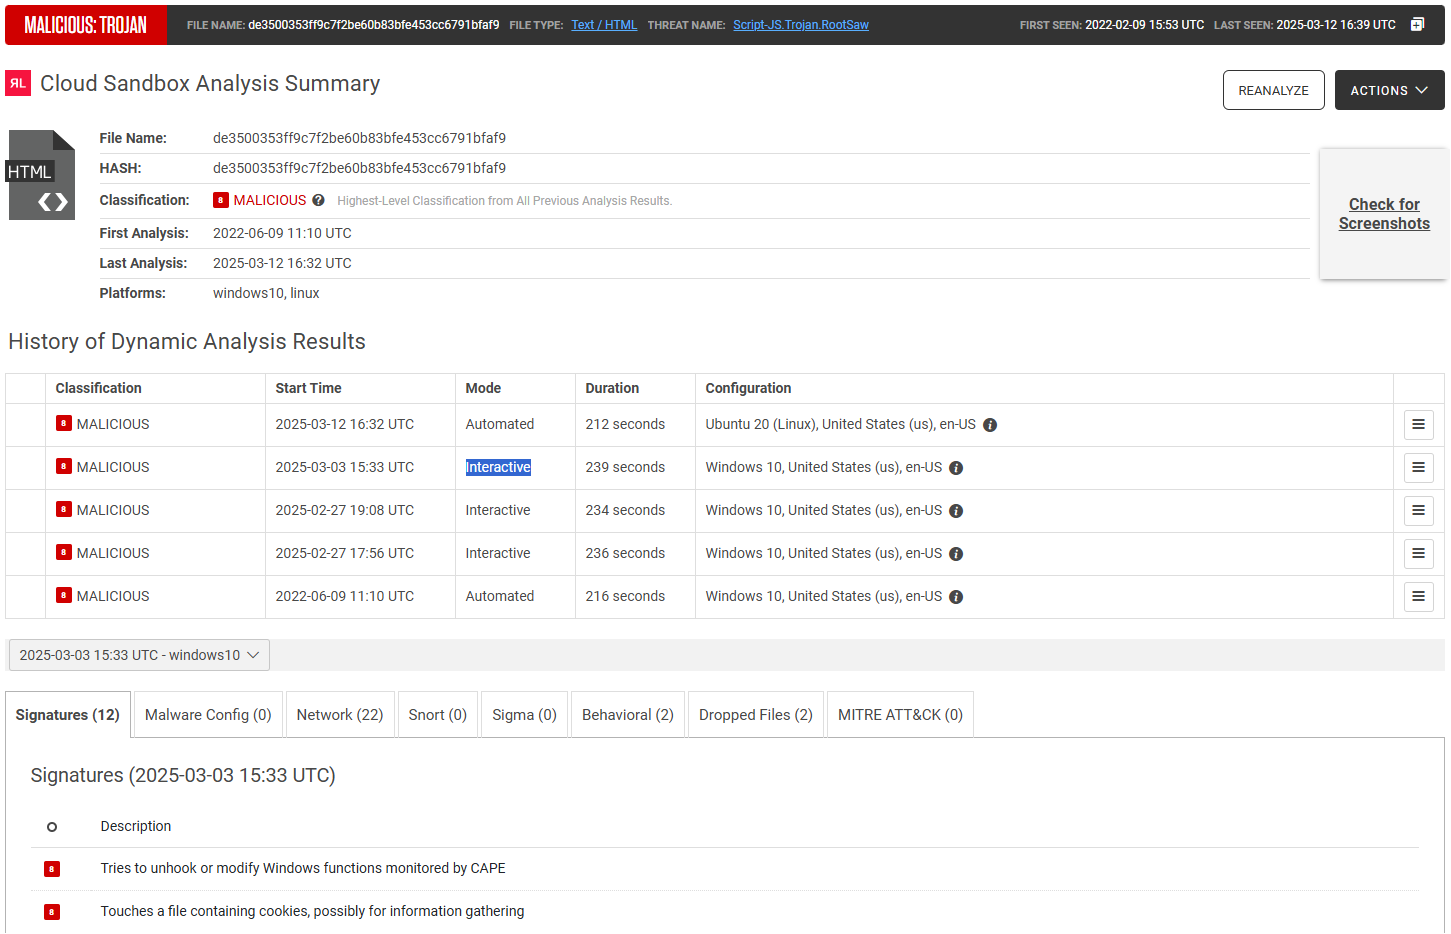
Full report details consist of:
- General file details: file name, hash, classification and other information.
- Screenshot gallery: click the thumbnail on the right to open a gallery of all collected screenshots, with the option to automatically advance through them in a slideshow. At the top of the gallery dialog, users can switch between different analyses to see the related screenshots.
- History of dynamic analysis results: table with the option to download dropped files and other artifacts for every individual analysis. These files are available for download for 1 year. If the analyzed sample is an email, this table also contains expandable sections with analysis reports for attachments and URLs found within the analyzed email sample.
- Additional information: available in a tabbed section with specific information obtained in dynamic analysis. This section can be filtered to show information from all performed analyses, or from a specific analysis. See the ReversingLabs Cloud Sandbox API sections for a detailed explanation of individual fields.
On this page, you can also click the buttons in the top right corner to do the following:
- Reanalyze: reanalyze the sample using the ReversingLabs Cloud Sandbox.
- Actions:
- Create PDF/HTML: download the report as HTML or PDF. When a PDF or HTML report is created, a new one cannot be created before 30 minutes have expired. Downloading HTML or PDF reports for dynamic analysis is also possible via API. If a new report export is necessary before the 30 minute period expires, use the Dynamic Analysis Report API.
- Download Latest Dropped Files: download the latest dropped files.
- Send Latest Dropped Files to Static Analysis: send the latest dropped files to static analysis.

Downloading artifacts
After a dynamic analysis run is completed, the following artifacts are available for download:
- Screenshots
- PCAP file
- Memstrings
- Dropped files
Downloading artifacts is possible only through the GUI.
The artifacts depend on each dynamic analysis run and can be downloaded from the History of Dynamic Analysis Results table, while the dropped files are available for download in the Dropped Files tab. These files are available for download for 1 year, the standard retention period for the Cloud Sandbox. The artifacts are downloaded as .7zip archives and their password is infected.
Analysis options
| Option | Description |
|---|---|
| Platform | Determines the platform the sample is executed on. Available as a per-analysis setting during file submission, and default settings per file type can be configured under Administration > Integrations & Connectors > Integrations. |
| Timeout | How long in seconds a sample can run in the sandbox virtual machine. Default: 200, Min: 30, Max: 500. ReversingLabs Cloud Sandbox may allow the VM to run longer if additional runtime could extract more intelligence. The timeout value may differ from the total analysis time which is reported as duration, and which includes sample execution including any extra time granted by RLCS, VM restore, client setup, and post-processing, for example, sending dropped files to the host. |
| Custom filename | A custom filename that helps track the file across ReversingLabs services. If omitted, the system applies smart sample naming automatically. |
| Internet simulation | Defaults to false. If set to true, dynamic analysis is performed without connecting to the internet and uses a simulated network instead. Setting to false is the same as omitting it from the request. HTTPS traffic information is not monitored when using this parameter. |
| Network traffic obfuscation | When internet simulation is disabled/omitted and samples are allowed to connect to the internet, network traffic obfuscation measures are implemented to protect the analysis infrastructure. Traffic obfuscation is achieved through VPN routing that masks the origin of network requests, preventing external entities from identifying the analysis environment. |
| Geolocation | Geographic location associated with the sample's network activity, reflecting the configured country from which the network traffic is egressed, set via VPN or similar routing methods. |
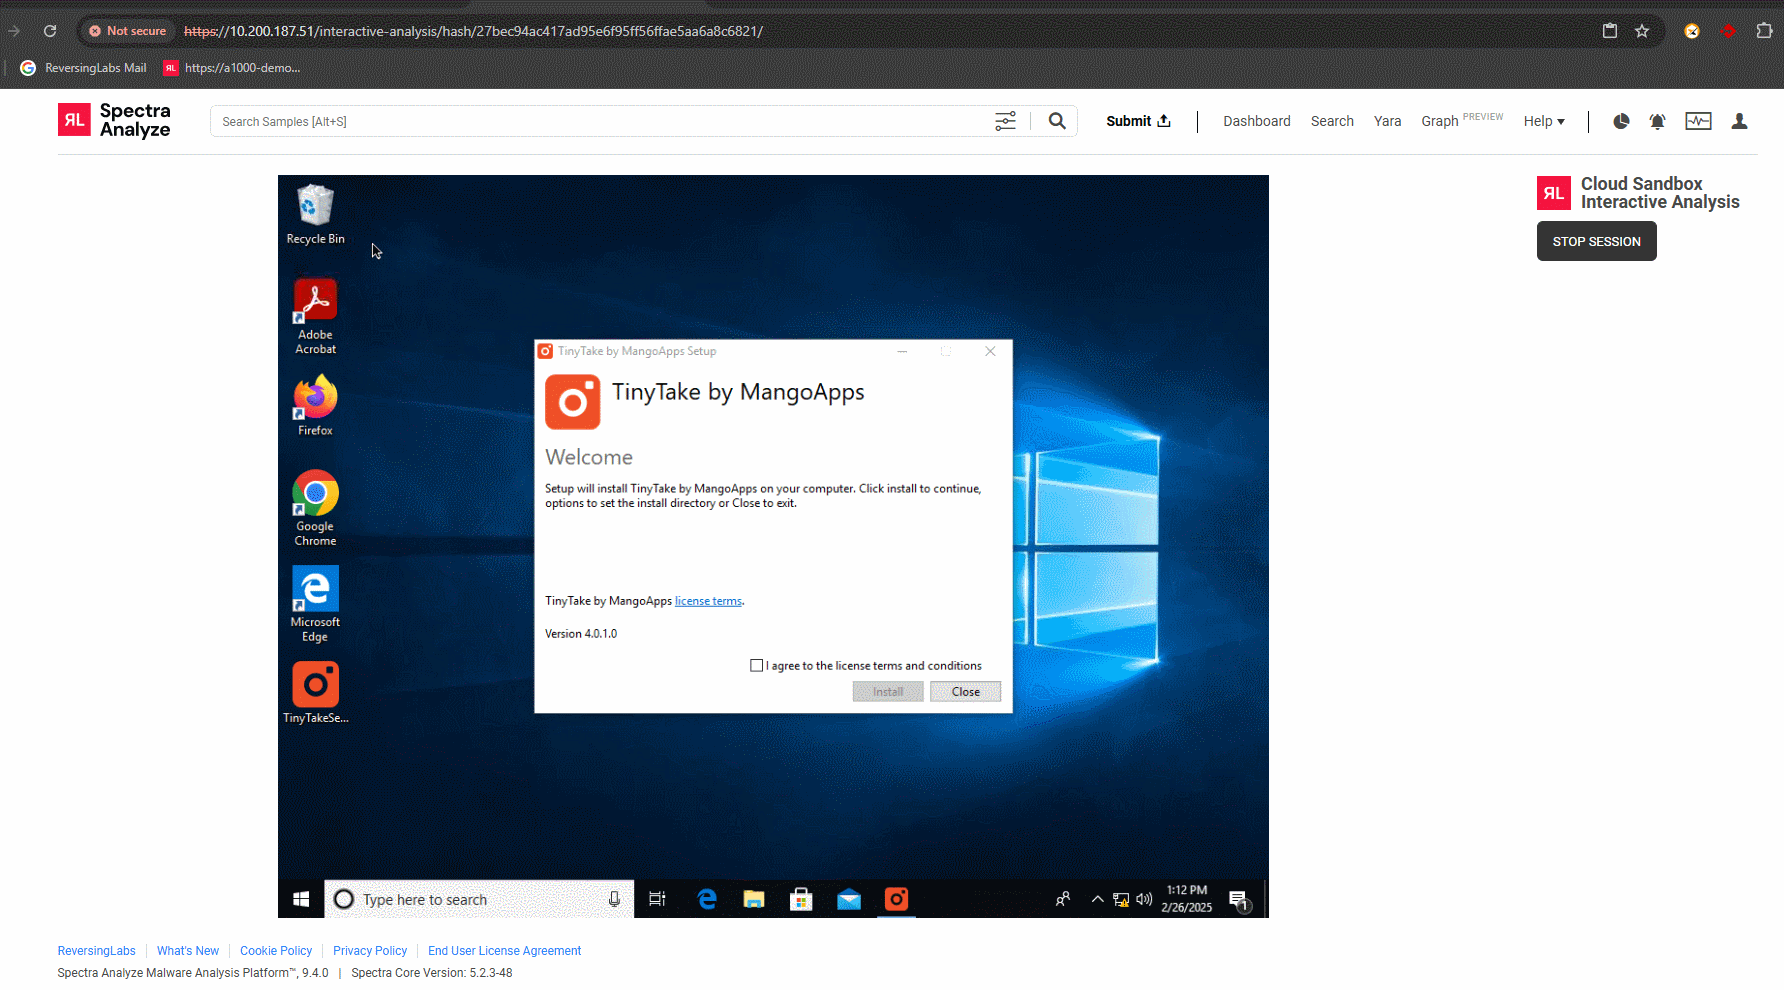
| Interactive analysis | Execute the sample and interact with it in an interactive session. Only available through Analyze/Reanalyze dialogs. If selected, a new tab opens with the interactive session. Once the session expires or is stopped by the user, its results are visible under Dynamic Analysis > Cloud Sandbox. |

Configuration settings
For more information about configuring this integration, see ReversingLabs Cloud Sandbox.
By default, Spectra Analyze automatically retrieves existing ReversingLabs Cloud Sandbox reports for files submitted to the appliance. If a file wasn’t previously scanned in the ReversingLabs Cloud Sandbox, it can be manually uploaded for dynamic analysis, or you can enable Automatic upload to do this automatically.
While the retrieval of existing reports is a basic Spectra Analyze feature, submitting files for dynamic analysis using the ReversingLabs Cloud Sandbox is available only as a feature preview with an upload limit of five samples per day. When the analysis quota is exceeded, the appliance shows a warning message whenever a new file is manually submitted for analysis.
Full access to this feature is available at additional cost. For more information, contact ReversingLabs Sales Support.
If the Automatic file retrieval option is enabled, all files dropped during dynamic analysis that are within configured file size limits are downloaded to the appliance and analyzed locally.
To allow dynamic analysis results to affect the final sample classification, enable the Include in classification option. When enabled, all future sample uploads, as well as any reanalyzed samples, may receive their final classification from the ReversingLabs Cloud Sandbox. Samples that already had a recent dynamic analysis classification before the option was enabled update their classification once their Sample Details Summary page is opened, or during regular appliance synchronizations with Spectra Intelligence.
Only ReversingLabs Cloud Sandbox can be configured to affect the final sample classification. Other analysis results do not affect the overall final classification of the sample, but are, rather, another source of information for analysts.
Administrators can also specify which File types are automatically submitted for dynamic analysis. The maximum supported file size of each individual sample submitted to the ReversingLabs Cloud Sandbox is 400 MB.
CAPE Sandbox
For more information about configuring this integration, see Integrations - CAPE Sandbox.
| Maximum supported file size | Submitting only distinct files | Queue limit & behavior |
|---|---|---|
| 400 MiB | Supported | Up to 60 submissions. Samples are considered queued if waiting for analysis. Running/processing samples do not count towards limit. For more information, see Queue limits and behavior. |
CAPE analysis reports are added under Dynamic Analysis > CAPE. CAPE offers two types of analysis: Behavioral and Network.
If enabled by an administrator, there is also a See Task on CAPE button at the top right of the section. This button redirects to the CAPE web interface, where it is possible to see more information about the file, and compare it to other analysis results.
Cisco Secure Malware Analytics
For more information about configuring this integration, see Integrations - Cisco Secure Malware Analytics.
| Maximum supported file size | Submitting only distinct files |
|---|---|
| 250 MiB | Not supported |
When Cisco Secure Malware Analytics finishes processing a sample, a report with the analysis results is sent to the Spectra Analyze appliance. This report can be accessed under Dynamic Analysis > Cisco Secure Malware Analytics.
Available reports from this integration include:
- Dropped files
- Indicators of compromise
- Networking
Cuckoo Sandbox
For more information about configuring this integration, see Integrations - Cuckoo Sandbox.
| Maximum supported file size | Submitting only distinct files | Queue limit & behavior |
|---|---|---|
| 400 MiB | Not supported | Up to 60 submissions. Samples are considered queued if waiting for analysis. Running/processing samples do not count towards limit. For more information, see Queue limits and behavior. |
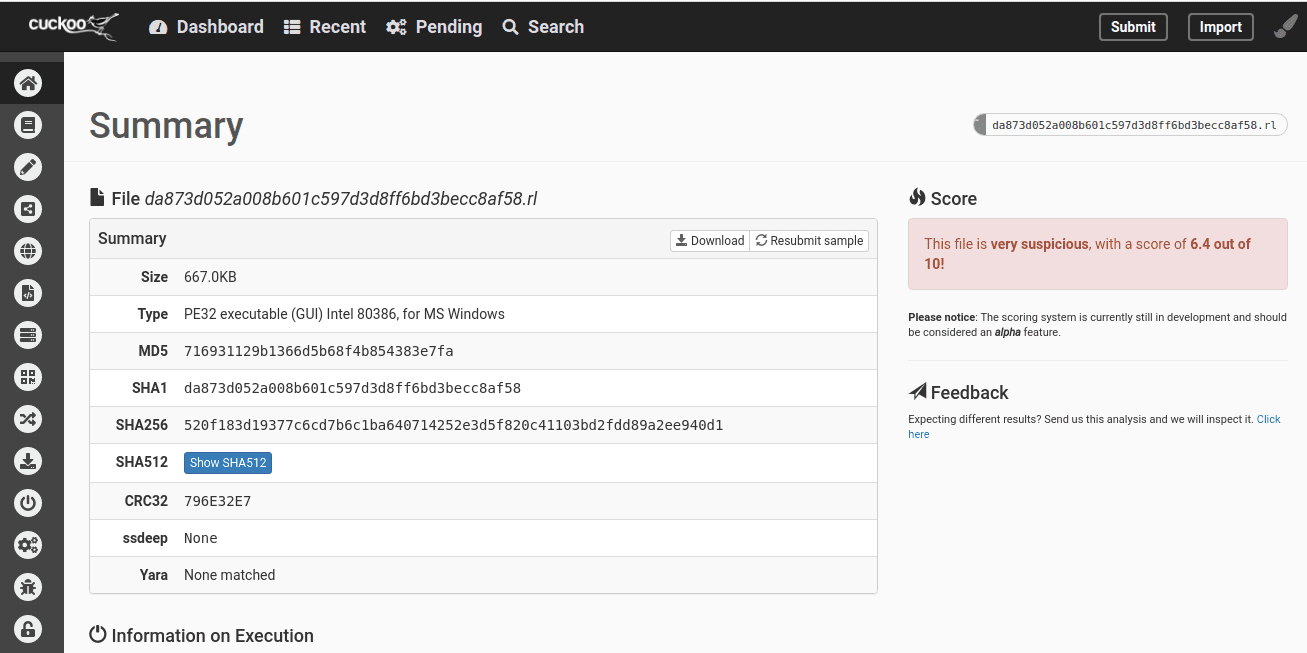
Cuckoo reports are added under Dynamic Analysis > Cuckoo. Cuckoo offers two types of analysis: Behavioral and Network.
If enabled by an administrator, there is also a See Task on Cuckoo button at the top right of the section. This button redirects to the Cuckoo interface, where it is possible to see more information about the file, and compare it to other analysis results.

FireEye Sandbox
For more information about configuring this integration, see Integrations - FireEye Sandbox.
| Maximum supported file size | Submitting only distinct files | Queue limit & behavior |
|---|---|---|
| 100 MiB | Not supported | Up to 100 submissions. Samples are considered queued if waiting for analysis or already being processed. For more information, see Queue limits and behavior. |
If FireEye is enabled by an administrator, the Fetch profiles button retrieves a list of profiles available on the FireEye instance. Supported file types can be assigned to profiles that are used for dynamic analysis. Each file type can be assigned to only one profile.
New samples of the supported file type assigned to a profile are automatically sent for dynamic analysis.
When FireEye finishes processing a sample, a report with the analysis results is sent to the Spectra Analyze appliance. This report can be accessed under Dynamic Analysis > FireEye.
For more details on configuring and using the FireEye integration, contact ReversingLabs Support (support@reversinglabs.com).
Joe Sandbox
For more information about configuring this integration, see Integrations - Joe Sandbox.
| Maximum supported file size | Submitting only distinct files | Queue limit & behavior |
|---|---|---|
| 400 MiB | Supported | Up to 20 submissions. Samples are considered queued if waiting for analysis. Running/processing samples do not count towards limit. On timeout, displays "Failed Upload" status message under Dynamic Analysis > Joe Sandbox. If this happens, the failed sample no longer remains in the queue. For more information, see Queue limits and behavior. |
If Joe Sandbox is enabled by an administrator, the Fetch profiles button retrieves a list of profiles available on the Joe Sandbox instance. Supported file types can be assigned to profiles that are used for dynamic analysis. Each file type can be assigned to only one profile.
New samples of the supported file type assigned to a profile are automatically sent for dynamic analysis.
Appliance administrators can check the status of the Joe Sandbox service on the System Status page, under External Services Connectivity.
Joe Sandbox analysis reports are added under Dynamic Analysis > Joe Sandbox. Clicking the section name in the sidebar opens the page with general information about Joe Sandbox, and details about the latest analysis.
If enabled by an administrator, there is also a See Task on Joe Sandbox button at the top right of the page.

The Behavior Analysis tab contains the process tree menu obtained from the Joe Sandbox JSON report.
The Network Analysis tab displays all network activity detected during dynamic analysis. The following protocols are listed: TCP, UDP, DNS, HTTP, HTTPS, FTP, ICMP, IRC and SMTP.
The Domains/IPs/URLs tab shows the extracted URIs in three separate tabs as they are differentiated in the HTML report. Public and private IP addresses are not in separate tabs; instead, they have a boolean attribute Private visible in the list.
VMRay
For more information about configuring this integration, see Integrations - VMRay.
| Maximum supported file size | Submitting only distinct files |
|---|---|
| 305 MiB | Not supported |
There is no need to retrieve available profiles/environments from VMRay and assign file types to specific platforms. Samples are sent to dynamic analysis according to how the VMRay instance is configured.
When VMRay finishes processing a sample, a report with the analysis results is sent to the Spectra Analyze appliance. This report can be accessed under Dynamic Analysis > VMRay.
Static analysis
For more information about configuring this integration, see Integrations - Static analysis.
Auxiliary analysis reports
| Maximum supported file size | Submitting only distinct files |
|---|---|
| 100 MiB | Not supported |
When ReversingLabs Auxiliary analysis finishes processing a sample, a report with the analysis results is sent to the Spectra Analyze appliance. This report can be accessed from the Sample Details page under Auxiliary Analysis.
The report for this integration includes the following report fields, including, but not limited to: general sample information, detected heuristics, ATT&CK information, extracted files, IOCs, threat score, and more.
The threat score of each file, including the sample and all extracted files, indicates its severity and helps interpret the classification.
| Score | Classification interpretation |
|---|---|
| - 1000 | Clean |
| 0 - 299 | Informational |
| 300 - 699 | Suspicious |
| 700 - 999 | Highly suspicious |
| >= 1000 | Malicious |
Auxiliary analysis services
| Service name | Speciality |
|---|---|
| APKaye | Android APK |
| Ancestry | File genealogy |
| Batchdeobfuscator | Deobfuscation |
| CAPA | Windows binaries |
| Characterize | Entropy analysis |
| ConfigExtractor | IoC extraction |
| DeobfuScripter | Deobfuscation |
| DocumentPreview | Visualization |
| EmlParser | |
| Espresso | Java |
| Extract | Compressed file |
| Floss | IoC extraction |
| FrankenStrings | String extraction |
| JsJaws | Javascript |
| MetaPeek | Meta data analysis |
| Oletools | Office documents |
| Overpower | PowerShell |
| PDFId | |
| PE | Windows binaries |
| PeePDF | |
| PixAxe | Images |
| Swiffer | Adobe Shockwave |
| TorrentSlicer | Torrent files |
| Unpacker | UPX Unpacker |
| ViperMonkey | Office documents |
| XLMMacroDeobfuscator | Office documents |