Graph Page [PREVIEW]
The Graph page provides an interactive visualization of relationships between malware samples, files, domains, IPs, and other entities. Users can create, view, and manage graphs to explore these connections.
The landing page displays a list of saved graphs, each represented by a thumbnail preview, name, creator, and last modified date. Users can search for graphs using the search bar at the top.
Click on any existing graph or create a new one to get started.
Graph Navigation
Use the mouse to navigate: click and drag the empty canvas to move around, scroll to zoom in or out. Click and drag the nodes to move them around.
Users can interact with nodes by clicking and dragging them. Left-click on a node to select it. A sidebar opens on the right side of the canvas, providing information on that specific node. Right-click on a node to access the context menu with options specific to that node. Control nodes, for example, offer options to load more child nodes or export a list of them.
Nodes
Root Nodes
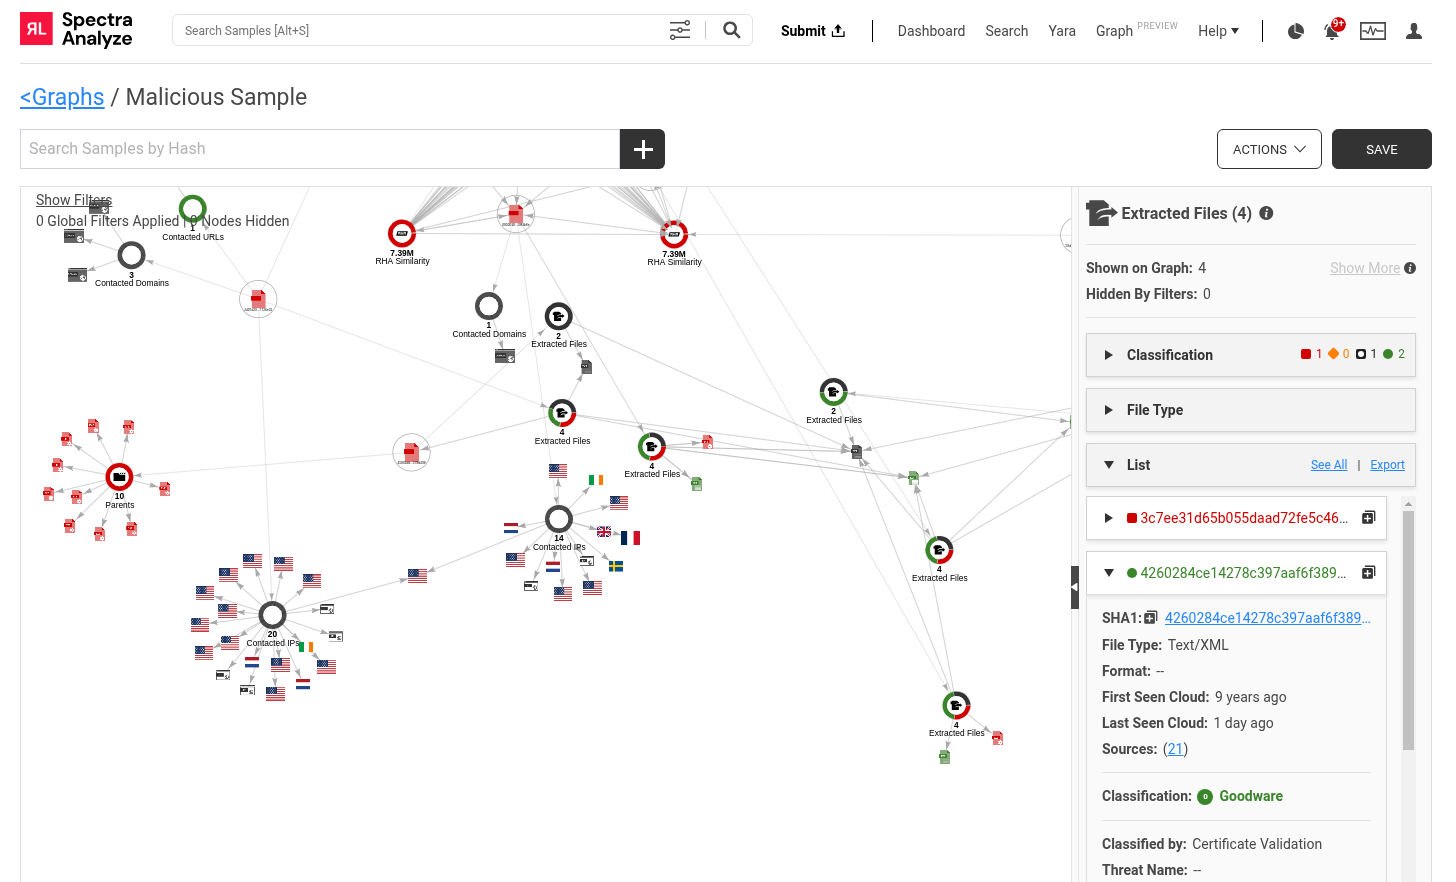
For graphs created by adding a single hash or by navigating from the sample summary page, the icon in the center of the graph represents the sample. Sample nodes will also be referred to as root nodes, as they serve as the starting points in the graph.
To add more root nodes to the graph, use the search bar at the top of the page, or promote an existing file node to a new root node.
File nodes can be promoted to root nodes via the sidebar or right-click menu. Selecting Expand or Fetch & Analyze (for cloud samples) transforms the node into a new root node, adding control nodes and integrating its relationships into the existing graph.
Control Nodes
Root nodes branch into control nodes, each representing a distinct type of relationship.
Control nodes act as entry points for exploring data. Each node is visualized as a color-coded pie chart showing the number of subnodes per classification: goodware, suspicious, malicious, or unknown. Initially, each control node displays up to 20 unique subnodes.
For cloud samples, fewer control nodes are available until the sample is fetched and analyzed from either the node sidebar or the search page to display additional relationship data.
The available control nodes are:
- Dropped files
- Extracted Files
- Parents and Sources
- (RHA) Similarity
- Static Network References
- Dynamic Network References
- Network References: Contacted URLs, Domains and IPs
Sidebar
The sidebar provides details and actions based on the selected node. Control nodes show statistics on subnodes, extracted file nodes display file reputation and threat names, and network reference nodes provide third-party reputations and classification reasons. When available, network reference nodes for extracted and contacted IP addresses display their country of origin.
To load more subnodes, select a control node and click Show more.
Highlighted and underlined items in the sidebar can be clicked to navigate to a different sample summary page, or to perform an advanced search query.
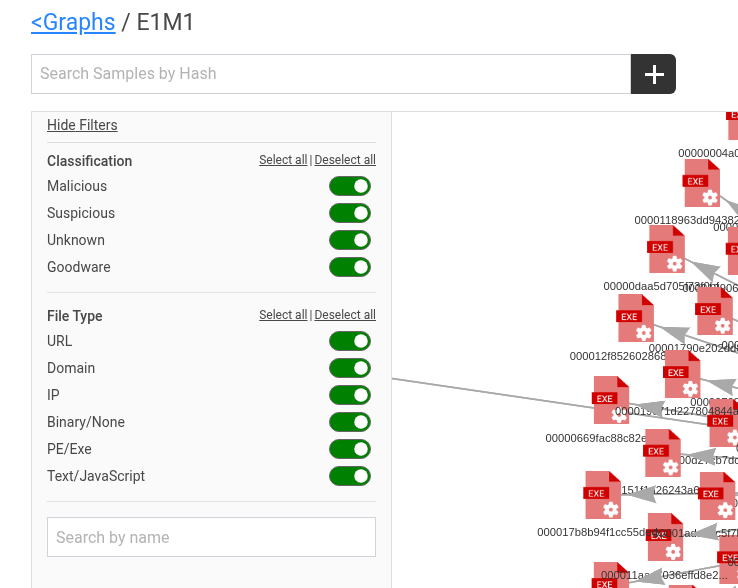
Filtering
Graphs can be filtered by classification, file type or file name. The filtering options are accessible via the the Show Filters button in the top left of the canvas.
Saving and Updating
Click Save when working on a new graph to open the save dialog, allowing you to choose a name. When you open a saved graph, it will load all references from the previous session, plus any new ones discovered since then.