Dynamic Analysis
The Spectra Analyze appliance optionally integrates with several dynamic analysis services, making it possible to automatically send samples for dynamic analysis, as well as to reanalyze samples using any of the supported services.
The ReversingLabs Cloud Sandbox can, optionally, be configured to affect the final sample classification. Third-party dynamic analysis results do not affect the overall final classification of the sample, but are, rather, another source of information for analysts.
Dynamic analysis services must be configured on the Administration > Integrations page by the appliance administrator. On that page, EDIT which file types you would like to analyze with each configured integration.
The integrations work with samples submitted through the graphical user interface (with the Submit file, Submit URL, and Reanalyze options), as well as with those submitted via the Submissions API. Dynamic analysis results are displayed on the Sample Details page of each analyzed sample.
Some integrations have the option to submit only distinct files. When this option is enabled, if a file has already been submitted to Spectra Analyze and analyzed, it will not be sent for reanalysis when it is submitted again. This option applies to files submitted to Spectra Analyze using the graphical user interface and via the Upload API. It does not affect the Reanalysis feature - you can still submit files for reanalysis with any of the integrations even if the files have already been analyzed. By default, this option is disabled for every integration.
ReversingLabs Cloud Sandbox
Spectra Analyze is integrated with the ReversingLabs dynamic analysis API, providing historical information on all dynamic analyses performed on the detonated sample, with detected indicators of compromise available through Advanced Search (using the uri-dynamic and ipv4-dynamic keywords), as well as through sections on the Sample Summary page.
For this service to be available, the appliance has to be connected to Spectra Intelligence. If the service is enabled, historic dynamic analysis results are shown for all samples that have them.
Dynamic Analysis Reports
Full report details consist of:
- General file details
- A thumbnail of one of the screenshots generated during analysis. Clicking the screenshot opens a gallery of all collected screenshots, with the option to automatically advance through them in a slideshow. At the top of the gallery dialog, users can switch between different analyses to see the related screenshots.
- Analysis history with the option to download dropped files and other artifacts for every individual analysis. These files are available for download for 1 year.
- Tabbed section with specific information obtained in dynamic analysis. This section can be filtered to show information from all performed analyses, or from a specific analysis.
MITRE ATT&CK
Techniques detected during dynamic analysis. This table shows techniques detected during file execution, and will differ from the MITRE ATT&CK table produced by Spectra Core static analysis.
Malware Configurations
C2 server URLs and IP addresses.
Network
Network resources contacted by the sample during execution.
Behavioral
List of processes the sample spawned and the actions they performed.
Signatures
Abstracted behaviors, attributes, and content identified during analysis. Each signature has a description and a risk score. Signatures commonly provide the following types of information:Behaviors and capabilities observed during execution of the sample. Attributes extracted via static analysis of the sample or artifacts generated during execution. Data-enrichment results, such as file reputation detections for the sample and any dropped files, Snort signature detections from network traffic, and YARA rule matches in the sample or process memory
Dropped Files
Files that the sample dropped during dynamic analysis. If the dropped files are available locally, you can interact with them and inspect them like any other file on Spectra Analyze. If the dropped files are not available locally, the Send Latest to Static Analysis button downloads files dropped during the last dynamic analysis from Spectra Intelligence and analyze them on the appliance. To automate this process, enable the Automatic Download and Analysis option in the Administration > Integrations > ReversingLabs Cloud Sandbox section. Clicking the Download Latest button packages the latest dropped files in a .zip archive and downloads them to the user’s computer.
Snort Alerts
Alerts for anomalous network traffic (link to the rules used).
Sigma Detections
Detections based on logged events.
Actions menu: The report can be downloaded as HTML or PDF. When a PDF or HTML report is created, a new one cannot be created before 30 minutes have expired. If a new report export is necessary before this 30 minute period, use the Dynamic Analysis Report API. This menu also contains options to download latest dropped files or send them to static analysis.
Downloading Artifacts
After a dynamic analysis run is completed, the following artifacts are available for download:
- screenshots
- PCAP file
- memstrings
- dropped files
The artifacts depend on each dynamic analysis run and can be downloaded from the History table, while the dropped files are available for download in the Dropped Files tab. These files are available for download for 1 year, which is the standard retention period for the Cloud Sandbox. The artifacts are downloaded as 7zip archives and their password is infected.
Using the Dynamic Analysis API
Downloading HTML or PDF reports for dynamic analysis is also possible via API and is described in the Dynamic Analysis API documentation. Downloading artifacts is possible only through the GUI.
Configuration
The Spectra Analyze integration with the ReversingLabs Cloud Sandbox can be configured on the Administration > Integrations page. By default, Spectra Analyze will automatically retrieve existing ReversingLabs Cloud Sandbox reports for files submitted to the appliance.
If the file wasn’t scanned in the Cloud Sandbox before, it will not be scanned until it’s manually uploaded for dynamic analysis, except if Automatic Upload is enabled.
While the retrieval of existing reports is a basic Spectra Analyze feature, submitting files for dynamic analysis using the ReversingLabs Cloud Sandbox is available only as a feature preview with an upload limit of 5 samples per day. When the analysis quota is exceeded, the appliance will show a warning message whenever a new file is manually submitted for analysis. Full access to this feature is available at additional cost. For more information, please contact ReversingLabs Sales Support (insidesales@reversinglabs.com).
If the Automatic Download and Analysis option is enabled, all files dropped during dynamic analysis that are within configured file size limits will be downloaded to the appliance and analyzed locally.
To allow dynamic analysis results to affect the final sample classification, enable the Include in Classification option. If enabled, all future sample uploads, as well as any reanalyzed samples, may receive their final classification from the Cloud Sandbox. Samples that already had a recent dynamic analysis classification before the option was enabled will update their classification once their Sample Summary page is opened, or during regular appliance synchronizations with Spectra Intelligence.
If no file types are specified (the Selected file types list is empty), and the automatic upload of files is enabled, all files uploaded to the appliance will indiscriminately be submitted for dynamic analysis, regardless if their file type is supported or not.
The maximum supported file size of each individual sample submitted to the ReversingLabs Cloud Sandbox is 400 MB.
Up to 20 submissions can be simultaneously queued for analysis. Samples are considered queued if they are waiting for analysis (those already in a running or processing state do not count towards the limit). If the queue is full, the appliance will attempt to resubmit a sample up to 5 times, with a delay of 20 seconds between each attempt, before timing out. If it fails to resubmit the sample, that sample will no longer remain in the queue.
ReversingLabs Auxiliary Analysis
| Maximum supported file size | 100 MiB |
|---|---|
| Submitting only distinct files | Not Supported |
When RL Auxiliary Analysis finishes processing a sample, a report with the analysis results is sent to the Spectra Analyze appliance. This report can be accessed from the Sample Details page of the processed sample by clicking the link in the sidebar.
The report for this integration includes the following report fields, including, but not limited to: general sample information, detected heuristics, ATT&CK information, extracted files, IOCs, and more.
CAPE v2 Sandbox
| Maximum supported file size | 400 MiB |
|---|---|
| Submitting only distinct files | Supported |
Up to 60 submissions can be simultaneously queued for analysis on CAPE. Samples are considered as queued if they are waiting for analysis (those that are already in a running or processing state do not count towards the limit). If the queue is full, the appliance will attempt to resubmit a sample up to 5 times, with a delay of 20 seconds between each attempt, before timing out. If it fails to resubmit the sample, that sample will no longer remain in the queue.
CAPE analysis reports are added to the Sample Details page as a separate section accessible from the navigation sidebar. CAPE offers two types of analysis: Behavioral and Network. If enabled in the Administration > Integrations > CAPE integration dialog, there will also be a See Task on CAPE button at the top right of the section.
This button redirects to the CAPE web interface, where it is possible to see more information about the file, and compare it to other analysis results.
Cisco Secure Malware Analytics
| Maximum supported file size | 250 MiB |
|---|---|
| Submitting only distinct files | Not Supported |
New in version 8.4.1: Option to send files privately.
When Cisco Secure Malware Analytics finishes processing a sample, a report with the analysis results is sent to the Spectra Analyze appliance. This report can be accessed from the Sample Details page of the processed sample by clicking the link in the sidebar.
Available reports from this integration include:
- Dropped files
- Indicators of compromise
- Networking
Cuckoo Sandbox
| Maximum supported file size | 400 MiB |
|---|---|
| Submitting only distinct files | Not supported |
Up to 60 submissions can be simultaneously queued for analysis on Cuckoo. Samples are considered as queued if they are waiting for analysis (those that are already in a running or processing state do not count towards the limit). If the queue is full, the appliance will attempt to resubmit a sample up to 5 times, with a delay of 20 seconds between each attempt, before timing out. If it fails to resubmit the sample, that sample will no longer remain in the queue.
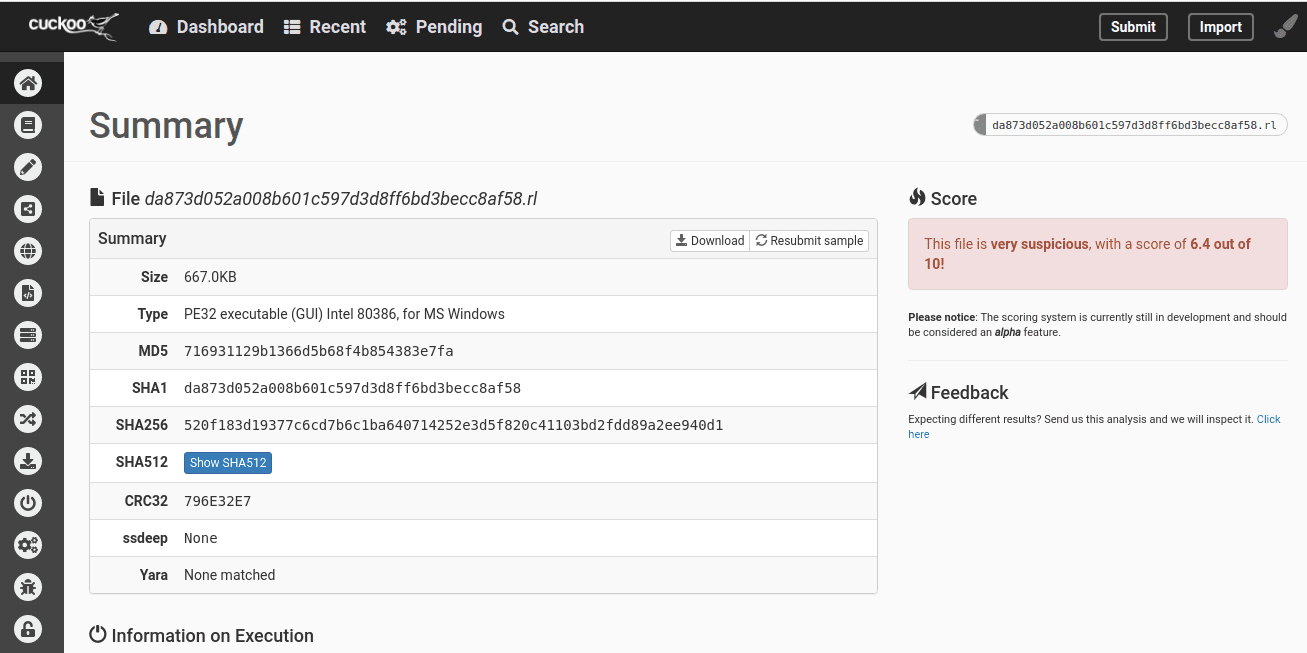
Cuckoo reports are added to the Sample Details page as a separate section accessible from the navigation sidebar. Cuckoo offers two types of analysis: Behavioral and Network. If enabled in the Administration > Integrations > Cuckoo integration dialog, there will also be a See Task on Cuckoo button at the top right of the section.

This button redirects to the Cuckoo interface, where it is possible to see more information about the file, and compare it to other analysis results.
FireEye Integration
| Maximum supported file size | 100 MiB |
|---|---|
| Submitting only distinct files | Not supported |
The FireEye API version must be selected in the configuration dialog.
After modifying the required fields in the configuration dialog, click the Save button to confirm changes. The appliance will be restarted.
Once the integration has been properly configured, the Fetch profiles button will retrieve a list of profiles available on the FireEye instance. Supported file types can be assigned to profiles that will be used for dynamic analysis. Each file type can be assigned to only one profile.
New samples of the supported file type assigned to a profile will be automatically sent for dynamic analysis.
Up to 100 submissions can be simultaneously queued for analysis on FireEye. Samples are considered as queued if they are waiting for analysis or if they are already being processed. If the queue is full, the appliance will attempt to resubmit a sample up to 5 times, with a delay of 20 seconds between each attempt, before timing out. If it fails to resubmit the sample, that sample will no longer remain in the queue.
When FireEye finishes processing a sample, a report with the analysis results is sent to the Spectra Analyze appliance. This report can be accessed from the Sample Details page of the processed sample by clicking the FireEye link in the sidebar (above Discussion).
For more details on configuring and using the FireEye integration, contact ReversingLabs Support (support@reversinglabs.com).
Joe Sandbox
| Maximum supported file size | 400 MiB |
|---|---|
| Submitting only distinct files | Supported |
Once the integration has been properly configured, the Fetch profiles button will retrieve a list of profiles available on the Joe Sandbox instance. Supported file types can be assigned to profiles that will be used for dynamic analysis. Each file type can be assigned to only one profile.
New samples of the supported file type assigned to a profile will be automatically sent for dynamic analysis.
Appliance administrators can check the status of the Joe Sandbox service in the External Services Connectivity section on the System Status page.
Up to 20 submissions can be simultaneously queued for analysis on Joe Sandbox. Samples are considered as queued if they are waiting for analysis (those that are already in a running or processing state do not count towards the limit). If the queue is full, the appliance will attempt to resubmit a sample up to 5 times, with a delay of 20 seconds between each attempt, before timing out and displaying a “Failed Upload” status message in the Sample Details > Joe Sandbox section. If this happens, the failed sample will no longer remain in the queue.
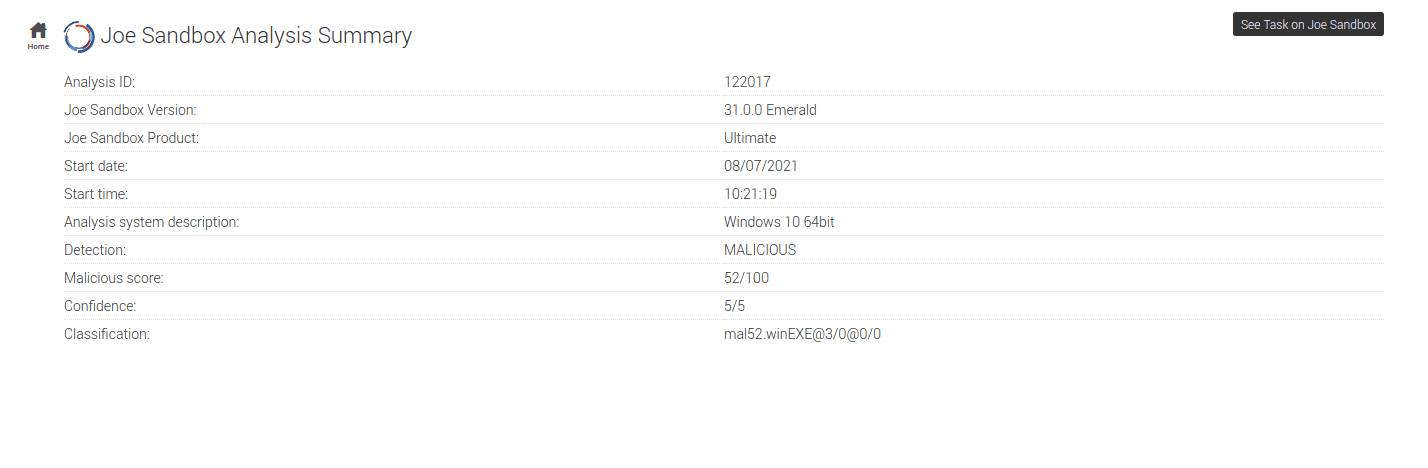
Joe Sandbox analysis reports are added to the Sample Details page as a separate section accessible from the navigation sidebar. Clicking the section name in the sidebar opens the page with general information about Joe Sandbox, and details about the latest analysis.
If enabled in the Administration > Integrations > Joe Sandbox integration dialog, there will also be a See Task on Joe Sandbox button at the top right of the page.
The Behavior Analysis tab contains the process tree menu obtained from the Joe Sandbox JSON report.
The Network Analysis tab displays all network activity detected during dynamic analysis. The following protocols are listed: TCP, UDP, DNS, HTTP, HTTPS, FTP, ICMP, IRC and SMTP
The Domains/IPs/URLs tab shows the extracted URIs in three separate tabs as they are differentiated in the HTML report. Public and private IP addresses are not in separate tabs; instead, they have a boolean attribute Private visible in the list.
VMRay Integration
| Maximum supported file size | 305 MiB |
|---|---|
| Submitting only distinct files | Not Supported |
There is no need to retrieve available profiles/environments from VMRay and assign file types to specific platforms, samples will be sent to dynamic analysis according to how the VMRay instance is configured.
When VMRay finishes processing a sample, a report with the analysis results is sent to the Spectra Analyze appliance. This report can be accessed from the Sample Details page of the processed sample by clicking the VMRay link in the sidebar.