Dashboard
The Dashboard displays statistics related to the amount and type of files that have been submitted and processed on the appliance within a specified time range.
At the top of the page is the Advanced Search box. The Advanced search box is a text field where users can enter search queries and get a pull-down list of all supported keywords. Recent search queries are preserved across the Dashboard and Search pages. See the Search Page page for more information.
Advanced Search also supports non-keyword searches, allowing the users to quickly build queries without using keywords.
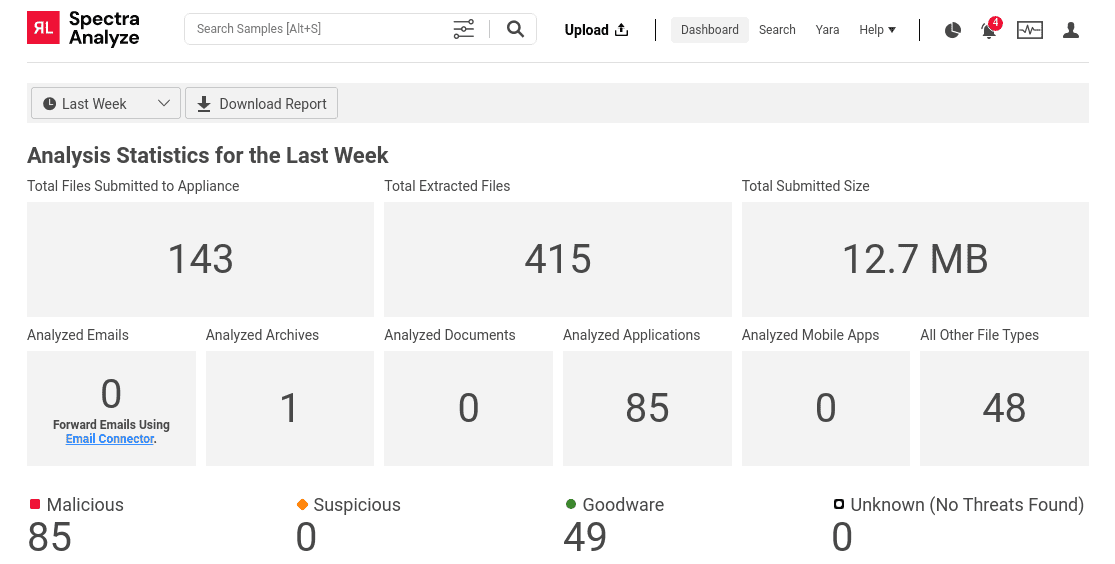
The time range filter allows users to set the period for which the data will be displayed on the Dashboard. All time values on the Dashboard refer to UTC time. By default, the time range filter is set to Last Week.
Clicking the Download Report button exports the current state of the dashboard page into a PDF file.
The first section of the dashboard, Analysis statistics, breaks down the number of files submitted to the appliance into multiple categories: file type, total amount of submitted files, total number of files extracted from submitted files, and total size of all submitted files.
The graphs in the second section display the classification distribution of analyzed files in the selected time range. Clicking a specific point in a graph opens the Search page filtered to display samples with that classification at the selected point in time.
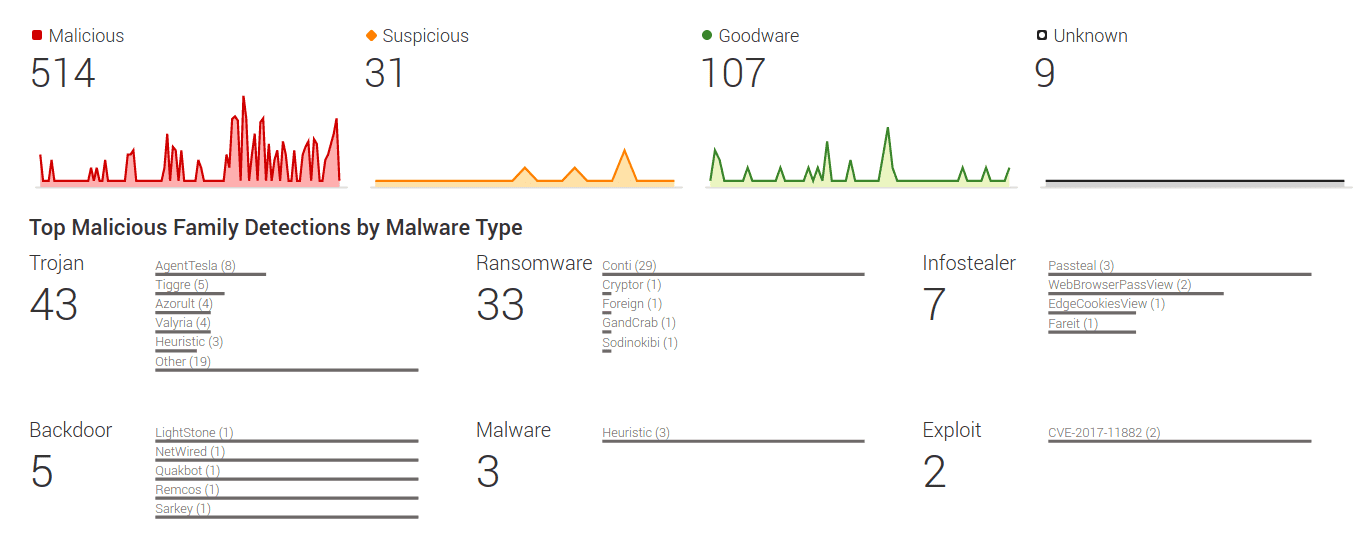
Top malicious family detections by malware type
This section displays the most common malware types detected in files analyzed in the specified time range. The most prevalent threat families for each malware type are listed with the count of samples they were detected in. Clicking any of the entries in this section opens the Advanced Search page with Local search results for the selected criteria (threat name, time range).
YARA Matches
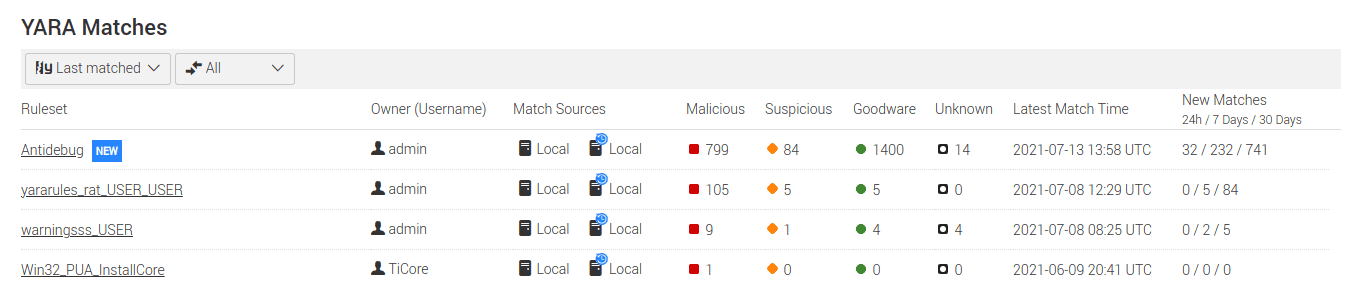
The YARA Matches table shows a quick overview of YARA hunting activities on the appliance, as well as in the Spectra Intelligence cloud. By switching between the two main views, users can see a list of their favorited YARA rulesets, or a list of rulesets with latest matches. Up to 10 YARA rulesets can be added to favorites by clicking the star button next to a ruleset on the YARA page. If there are no favorited YARA rulesets, the table will default to the Last matched view.
Both table views can be further filtered by match sources. Filtering can be configured to show All matches, or just one of the following categories: Local, Cloud, Local Retro, or Cloud Retro.
Each table row shows the YARA ruleset name, its owner, one or more match sources, the number of matches per classification (Malicious, Suspicious, Goodware, Unknown), the latest match time, and the number of new matches in the last 24 hours/7 days/30 days. Rules with matches in the last 24 hours will have a label “NEW” next to their name.
Clicking a specific ruleset name opens the ruleset on the YARA page.
Timeline analysis for detected malware samples
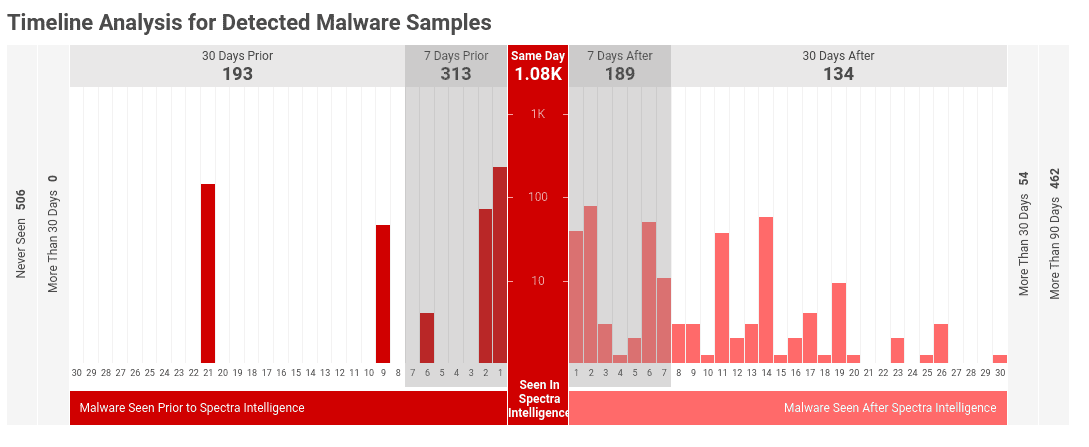
The timeline section displays all malicious samples present on the appliance, highlighting the difference between their local and cloud classification times. This section is not affected by the time range filter at the top of the Dashboard page. It always shows all available information.
The data set displayed in the section includes all malicious samples on the appliance, regardless of whether they were submitted to the appliance by the users or downloaded from Spectra Intelligence.
Depending on the time difference between the local and cloud classification times, all malicious samples available on the appliance fall into one of the categories listed in the following table.
| Category | Description |
|---|---|
| Never Seen | Samples classified as malicious by the appliance that were never seen in the Spectra Intelligence cloud. If the appliance is not connected to Spectra Intelligence, all malicious samples will be categorized as “Never Seen”. |
| More Than 30 Days | Samples that were first seen in the Spectra Intelligence cloud more than 30 days after they were classified as malicious by the local appliance. |
| 30 Days Prior | Malicious samples that were first seen in the Spectra Intelligence cloud 7-30 days after they were classified as malicious by the appliance. Apart from the aggregate number of samples on top, this section is broken down into columns with daily totals. |
| 7 Days Prior | Malicious samples that were first seen in the Spectra Intelligence cloud up to 7 days after they were classified as malicious by the appliance. Apart from the aggregate number of samples on top, this section is broken down into columns with daily totals. |
| Same Day | Samples that were locally classified as malicious and first seen in the Spectra Intelligence cloud on the same day. |
| 7 Days After | Malicious samples that were first seen in the Spectra Intelligence cloud up to 7 days prior to the local classification time. Apart from the aggregate number of samples on top, this section is broken down into columns with daily totals. |
| 30 Days After | Malicious samples that were first seen in the Spectra Intelligence cloud 7-30 days prior to the local classification time. Apart from the aggregate number of samples on top, this section is broken down into columns with daily totals. |
| More Than 30 Days | Malicious samples that were first seen in the Spectra Intelligence cloud 30-90 days prior to the local classification time. |
| More Than 90 Days | Malicious samples that were first seen in the Spectra Intelligence cloud more than 90 days prior to the local classification time. |
Top email threats collected during sample analysis
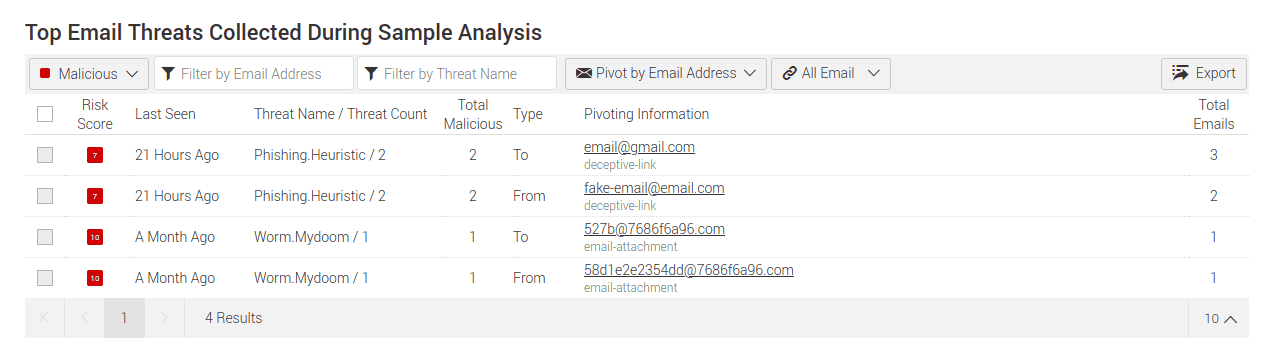
The email threats table shows the list of email samples grouped by email address or email subject. It can be filtered by classification, email address or email subject, threat name and type.
Classification filter - By default, the table shows email samples classified as malicious, but it can be filtered to show goodware, suspicious, or unknown samples. Setting this filter to All Classified shows all email samples regardless of classification. If this filter option is selected, some table columns will be empty because every extracted email address/subject can originate from samples with varying classifications, and data can’t be aggregated in a meaningful way.
Threat name and email filter - The two text fields can be used to filter results by threat name and, depending on the option selected in the Pivot by pull-down menu, either email address or subject. Both fields support autocompletion, and suggest only those options that exist in the table. Filtering by threat name is possible only when the table is filtered to show malicious or suspicious samples.
Pivot by pull-down menu controls the contents of the Pivoting information column in the table (email address or email subject), and affects what can be filtered using the email filter text field.
Email address type filter - Available only when pivoting is set to Email address. This filter can be used to display samples that have the extracted email address in either the “To” or “From” field. This filter is disabled when the table is filtered to pivot by email subjects.
Export - The entire table can be exported as a CSV file by clicking Export in the upper right corner of the table. To export a single page, select it using the checkbox left of the Risk Score column title before clicking the Export button. Selecting and exporting individual table rows is currently not supported.
The data in the email threats table is organized into the following columns.
Risk Score - All emails are assigned a Risk Score value that corresponds to the severity value of the most prevalent threat name detected in samples containing the extracted email address or subject.
Last seen - Indicates when the appliance last recorded the sample(s) containing the threat.
Threat Name / Threat Count - The name of the threat with the most detections related to each entry is listed in this column. Threat Count is the number of samples containing both the pivoting information and the detected threat. Click the threat name in the Threat Name column to perform an Advanced Search query.
Total Malicious - Shows the number of email samples classified as malicious that contain the listed pivoting information. The title of this column will dynamically change to match the classification selected in the classification filter above the table.
Pivoting information - Contains the email addresses/subjects, depending on the option selected in the Pivot by filter. To see a list of samples containing a specific address/subject, click the links to perform an Advanced Search query. Email-related tags are displayed below each of the entries. Clicking any of the tags performs an Advanced Search query.
Total Count - Total number of samples containing the pivoting information.
Top URIs collected during sample analysis
The URI table shows a list of malicious and/or interesting URIs extracted from files analyzed in the specified time range.
Filters - The URI table can be filtered by URI type, origin and threat name. Filtering by threat name can be performed by typing the threat name into the “Filter by threat name” text field. This field supports autocompletion, and suggests only those threat names that can be found in the table. To reset the filter, select the “–” entry from the pull-down list.
Filtering by origin allows users to see URIs extracted as a result of static analysis, dynamic analysis, and/or those that have been extracted from malware configuration files. All three origin sources are enabled by default.
The Type filter offers filtering by Domain, IP, or Link.
| Filter | Description |
|---|---|
| Domain | The table will show URIs recognized as domains. |
| Link | The table will show URIs recognized as links. |
| IP | The table will show URIs recognized as an IPv4 or IPv6 address. |
| All | Resets the filter to show all URIs. |
Export - The entire table can be exported as a CSV file by clicking Export in the upper right corner of the table. To export a single page, select it using the checkbox left of the Risk Score column title before clicking the Export button. Selecting and exporting individual table rows is currently not supported.
The data in the URI table is organized into the following columns.
Risk Score - All URIs are assigned a Risk Score value. It is a measure of how interesting the URI may be to the user, and calculated by a ReversingLabs proprietary algorithm.
Last seen - Indicates when the appliance last recorded the sample(s) containing the URI.
Threat Name / Threat Count - If any threats are found within samples containing a specific URI, the most prevalent threat name is listed in the Threat Name / Threat Count column. Threat Count shows the number of samples containing both the URI and the detected threat. Click the threat name in the Threat Name column to perform an Advanced Search query.
Total Count - The number of samples containing the URI. To see a list of these samples, click the URI in the Pivoting information column to perform an Advanced Search query.
Type - Categorizes the URI as Domain, Link, or IP. URIs recognized as links have download buttons next to them, allowing the user to download and submit the URI for analysis. If the URI points to a web page, the appliance will crawl its contents and download the web page as a compressed file. The page is crawled 1 level deep, regardless of the domain. URIs pointing to files are treated as single file downloads/submissions. All downloaded URIs can be found on the Advanced Search page.
Pivoting information - Contains all URIs or a specific type of URI (depending on the option selected in the Type filter) extracted from files on the appliance. Clicking a URI in this column performs an Advanced Search query to find all files containing the URI. URI-related tags are displayed below each of the URIs. Clicking any of the tags performs an Advanced Search query to find all files tagged with the same System Tag in the time range selected on the Dashboard.
Origin - Indicates the source from which the appliance extracted each URI. Supported sources are static analysis results, dynamic analysis results, and malware configuration files.