Administration Guide
The Administration Guide contains information about setting up the appliance and modifying its configuration.
Configuration options described in the following sections are accessible only to appliance administrators (users with administration privileges). Regular users should not be able to access or modify the configuration options on the appliance.
For any questions regarding the information in this Administration Guide, please contact ReversingLabs support.
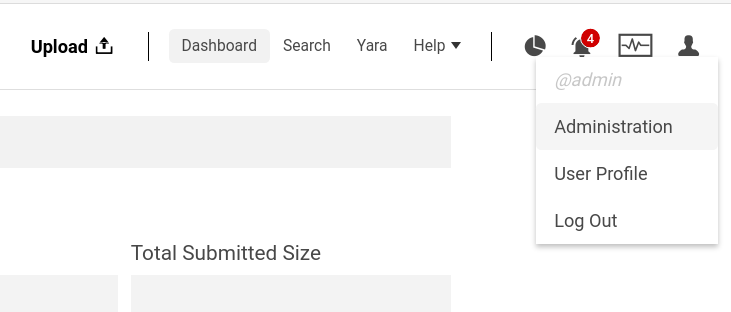
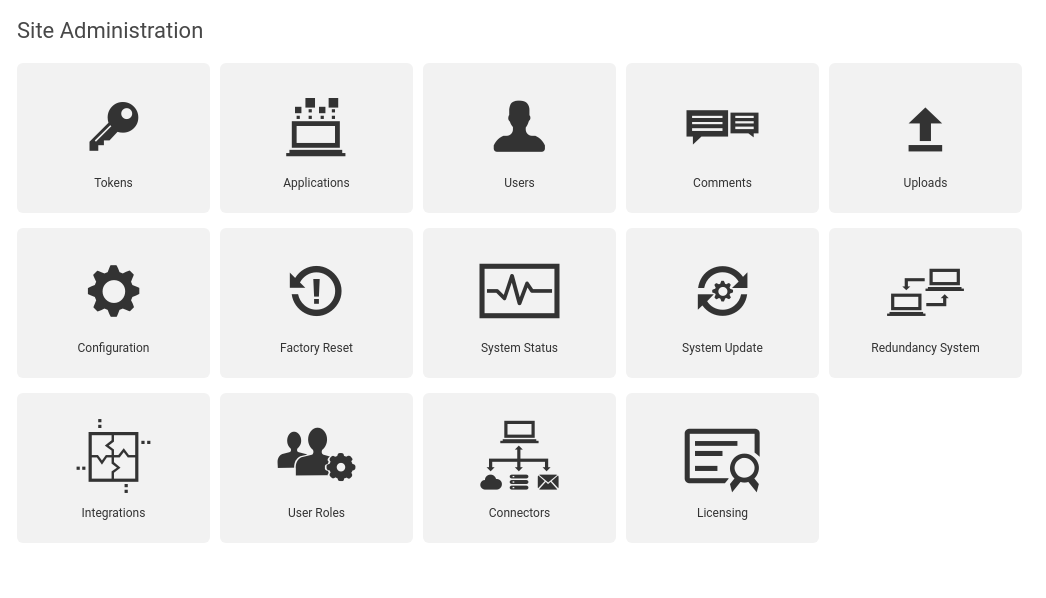
The Administration page serves as a starting point to all system configuration options on the appliance. Access it by selecting the Administration option in the User menu at the top right of the web interface.
The following pages can be accessed from the Administration page.
- Tokens
- Applications
- Users
- Comments
- Uploads
- Configuration
- Backup & Purge (if enabled)
- Factory reset
- System status
- System update
- Redundancy system (if enabled)
- Integrations
- User Roles
- Connectors
- Licensing
Tokens
Authentication tokens are per-user keys for authenticating to the Spectra Analyze APIs. The Tokens page offers a user-friendly way to manage them.
The list of tokens supports multi-column ordering. The contents of every column can be sorted in ascending or descending order by clicking the column name. When another column name is clicked, the ordering priority is shifted to the new column and indicated by numbers next to the column names.

Tokens are not automatically created for users. To create a new one, click the Add Token button.
The next step is to select a user from the pull-down menu and save changes to assign a token to the selected user. It is also possible to add a new user by clicking the green plus button next to the pull-down menu.
To change an existing token, click its name in the Key column on the Tokens page. The page that opens also contains a History link that displays the history of changes related to that particular token.
To remove one or more tokens, select them on the Tokens page and choose the option Delete selected tokens from the Action menu above the list of tokens.
Applications
The Applications page allows adding, removing, and modifying applications which are authorized to access the REST API of the Spectra Analyze appliance.
The primary function of this section is to enable communication between ReversingLabs Spectra Detect Manager and Spectra Analyze appliances. However, it is typically not necessary to manually edit applications on this page, since the configuration happens automatically when appliances are added to Spectra Detect Manager.
The list of applications supports multi-column ordering. The contents of every column can be sorted in ascending or descending order by clicking the column name. When another column name is clicked, the ordering priority is shifted to the new column and indicated by numbers next to the column names.
To add a new application, click the Add Application button, then enter the name and host name of the application.
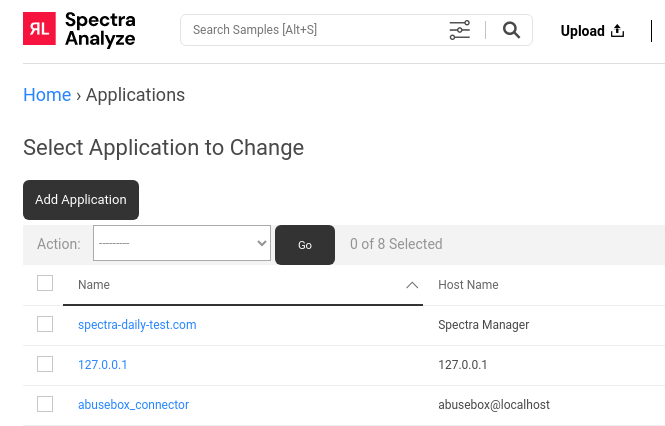
To remove one or more applications, select them on the Applications page and choose the Delete selected applications option from the Action menu.
Clicking the application name in the Name column opens the Change application dialog. The only settings that can be changed are the application name and host name.
Users, Comments, Uploads
The Users, Comments, and Uploads pages provide a general overview and the options to manage (create, delete and update) records at an administrative level. They all have a similar appearance and options.
Users

The Users page contains a search bar for finding specific users by name or by their email address. The search is case-insensitive. The Action menu allows deleting selected users. Using the sidebar on the right side of the page, the list of users can be filtered by user status (active, superuser), date joined (when the user account was created), date of last login, and roles.
The list of users supports multi-column ordering. The contents of every column can be sorted in ascending or descending order by clicking the column name. When another column name is clicked, the ordering priority is shifted to the new column and indicated by numbers next to the column names.
To create a new user, click the Add User button. The Add user dialog requires the username, password, email address, and user role for the new user account. Optional fields allow providing the user’s first and last name.
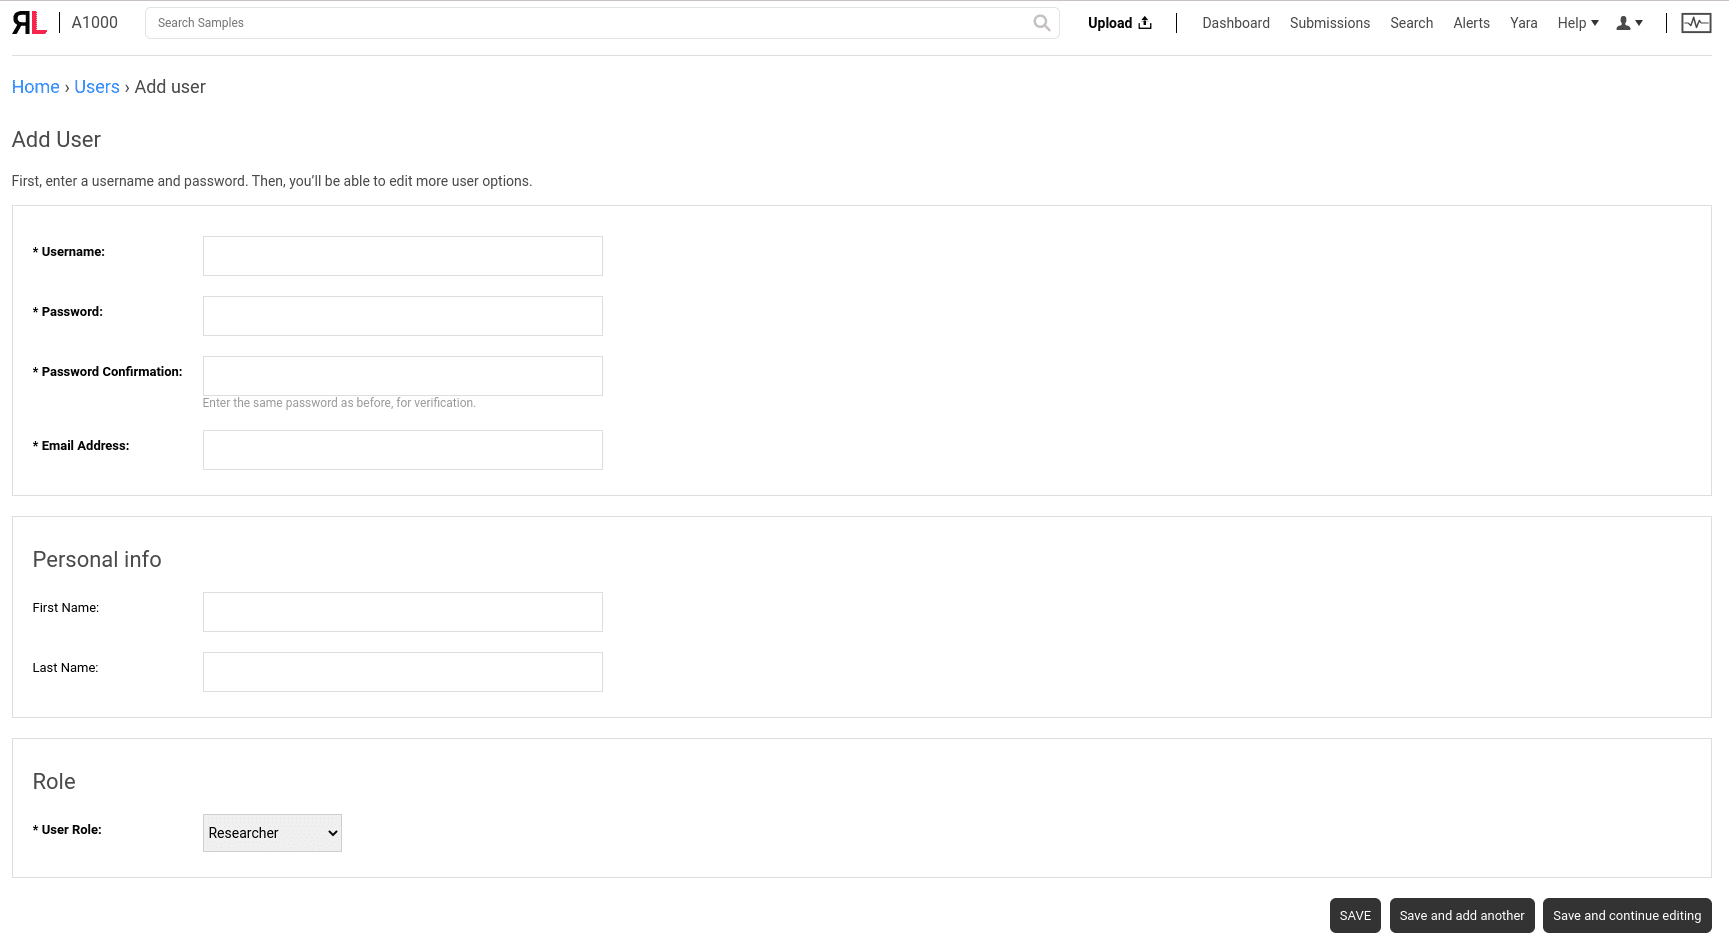
To edit an existing user’s settings, click their username in the list. The dialog that opens is similar to the Add user dialog, with three additional sections.

The Permissions section allows changing the user’s status to Active and Superuser. The Important dates section lists the dates when the user was added and when they last logged in.
Assigning a user role is mandatory. Superusers (or administrators) have full access to all features, regardless of the User Role assigned to them.
To remove a user, it is recommended to set their status to inactive by deselecting the Active checkbox instead of deleting the user account. When removing a user who has created some YARA rulesets on the appliance, the ownership of those rulesets is automatically transferred to the administrator account that removed the previous owner account.
An administrator cannot remove or deactivate their own account while they are logged in. An administrator account can only be removed or deactivated by another administrator account.
User Directory Settings
The Spectra Analyze appliance supports user account management with the Lightweight Directory Access Protocol (LDAP). LDAP authentication can be enabled and configured in the User Directory section of the System Configuration page.
Importantly, the existing local accounts on the appliance will not be managed or in any way affected by LDAP when its configuration changes.
Similarly, any username conflicts between LDAP and existing user accounts on the appliance will resolve in the favor of the existing account. For example, if an account named “goodware” exists on the appliance, it will not be possible to assign the same name to an LDAP account.
Users added via the User Directory synchronization will automatically be assigned a user role. Users marked as Superuser will have the All Permissions user role. Otherwise, they will be assigned the Researcher user role.
Comments
The Comments page displays a list of comments added to samples. Clicking a comment in the list opens the Discussion section of the Sample Details page.
The comments are associated with a sample, not with its individual uploads. It is possible to upload a sample multiple times, but adding a comment to one of those instances makes it visible on all of them, since they all represent the same sample.
The list of comments supports multi-column ordering. The contents of every column can be sorted in ascending or descending order by clicking the column name. When another column name is clicked, the ordering priority is shifted to the new column and indicated by numbers next to the column names.
It is also possible to remove multiple comments at once by selecting them and choosing the Delete selected comments option from the Action menu.
Uploads
The Uploads page is useful for filtering samples by state (Unprocessed, Processing, Processed, Error) to discover samples with errors. It also allows searching for uploaded samples by their file name, hash (SHA1, SHA256, MD5), and by name of the user who uploaded them (case-insensitive).
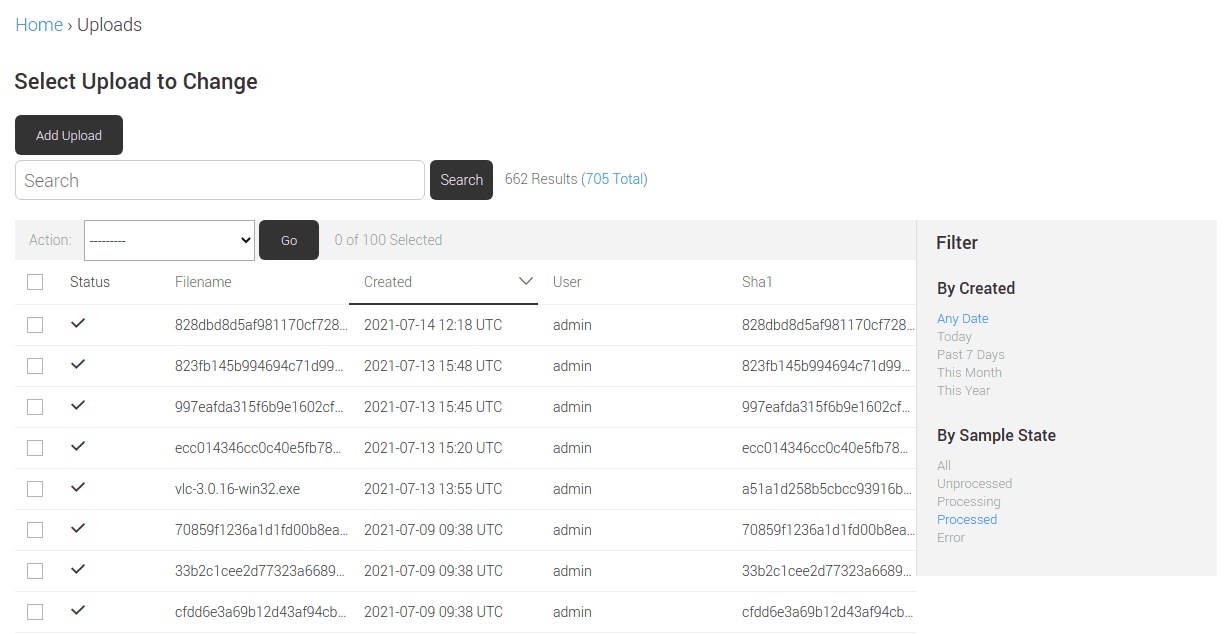
All columns in the list of uploads except Status support multi-column ordering. The contents of every column can be sorted in ascending or descending order by clicking the column name. When another column name is clicked, the ordering priority is shifted to the new column and indicated by numbers next to the column names.
Backup and Purge
The Backup & Purge features provide an automated way to manage storage space on the Spectra Analyze appliance. The Backup feature lets users perform database backups, and restore the appliance database from previous backups.
With Purge, users can define which samples are considered old and have them automatically removed at scheduled times. Additionally, users can clean up the database and the samples at any time by manually running the Purge task.
To access the Backup & Purge features from the Administration page, first enable the Backup & Purge option in the dialog on the System Configuration page.

When enabled, the Purge task automatically runs every day at midnight (00:00 UTC). It is not triggered immediately upon being enabled in the configuration dialog. It is also possible to schedule the Purge task to run at any other time of day, week, and month. While the Purge task is running, the appliance is switched to maintenance mode and cannot be used until the Purge task completes.
Setting the Purge retention period
The Purge feature allows users to set the retention period - how long the uploaded samples should be preserved on the appliance before they are considered old and removed.
The retention period can be modified by changing the Purge data older than value. The default retention period is 1 month. Other supported retention period values are: 1 week, 2 weeks, 3 months, 6 months, and 12 months.
ReversingLabs strongly advises the following:
- start with short retention periods and monitor the disk usage, then increase the retention period incrementally to accommodate observed usage patterns
- regularly monitor disk usage to avoid outages and performance issues
Purging samples based on their classification
The configuration dialog allows selecting which samples will be removed by the Purge action based on their classification and status.
It’s possible to select Malicious, Suspicious, Goodware, Unknown, Error State or any combination of those statuses. Samples matching the selected status(es) and older than the set interval will be removed the next time Purge is activated.
By default, all statuses except Malicious and Error State are selected.
Scheduling the Purge task
The Purge schedule section in the configuration dialog allows users to schedule how often the Purge task should be performed (monthly, weekly, daily).
Additional options apply depending on the selected frequency (day(s) of the month for monthly purge; day(s) of the week for weekly purge). Users can also select at which hour of the day the purge should run (in UTC).
If available, statistics from previous purge actions are displayed to help users determine the optimal schedule.
It’s not possible to to execute the Purge task manually while a scheduled purge is already in progress.
Running the Purge task manually
When enabled, the Purge task runs automatically every day at midnight (00:00 UTC). However, users can run it at any time by clicking the Run Purge link on the Administration > Backup & Purge page.
This action will perform data removal according to the criteria defined in the configuration dialog.
Before running the Purge action manually, make sure that the desired classification statuses are selected in the configuration dialog. By default, all statuses except Malicious are selected, which means all samples classified as Malicious will not be deleted when Purge is activated. It’s not possible to execute the Purge action manually twice in quick succession, or while a scheduled Purge task is already in progress.
If a backup should be performed, the Backup database before purging checkbox must be selected in the configuration dialog. When this option is not selected, only the Purge action is performed - meaning, the samples are deleted without creating a backup first.
While the Purge task is running, the appliance is switched to maintenance mode and cannot be used until the Purge task completes.
Daily maintenance task
In addition to the user-configurable Purge task, the appliance automatically runs a daily maintenance task that cleans up the database and removes samples without sources (such as leftover samples that the users deleted during the previous day). This can help prevent deadlocks and process scheduling issues when attempting to delete samples from the appliance.
The daily maintenance task runs at the same hour selected in the Administration > Configuration > Backup & Purge > Hour of the day (UTC) option. It will run only if the disk usage exceeds 65% and if it has not been run in the last 24 hours.
When the daily maintenance task is executed, the appliance enters the maintenance mode and cannot be used until the task completes.
The daily maintenance task cannot be disabled on the appliance. If Backup & Purge is not enabled on the appliance and the Hour of the day is not configured by the appliance administrator, the maintenance task will run at midnight UTC by default.
Performing backups
When Backup and Purge are enabled on the appliance, the Backup task runs automatically along with the Purge task if the Backup database before purging checkbox is selected in the configuration dialog.
Users can also perform a backup at any time by clicking the Run Backup link on the Administration > Backup & Purge page. While the backup process is running, the appliance will operate with degraded performance.
The database backup file will be automatically created in the PostgreSQL database format. The filename of the backup file contains the date and time when the backup was performed, in the following format: database-a1000-[date-time].dump. By default, the database backup file is stored in the /data/tcbase-backup directory on the appliance.
The duration of the backup process and the size of the backup file vary depending on the appliance configuration and retention parameters.
Backup files contain analysis information, including the verdict and analysis results. Configuration and original files are not backed up.
The Spectra Analyze appliance does not store multiple database backup files - every new backup overwrites the previous one.
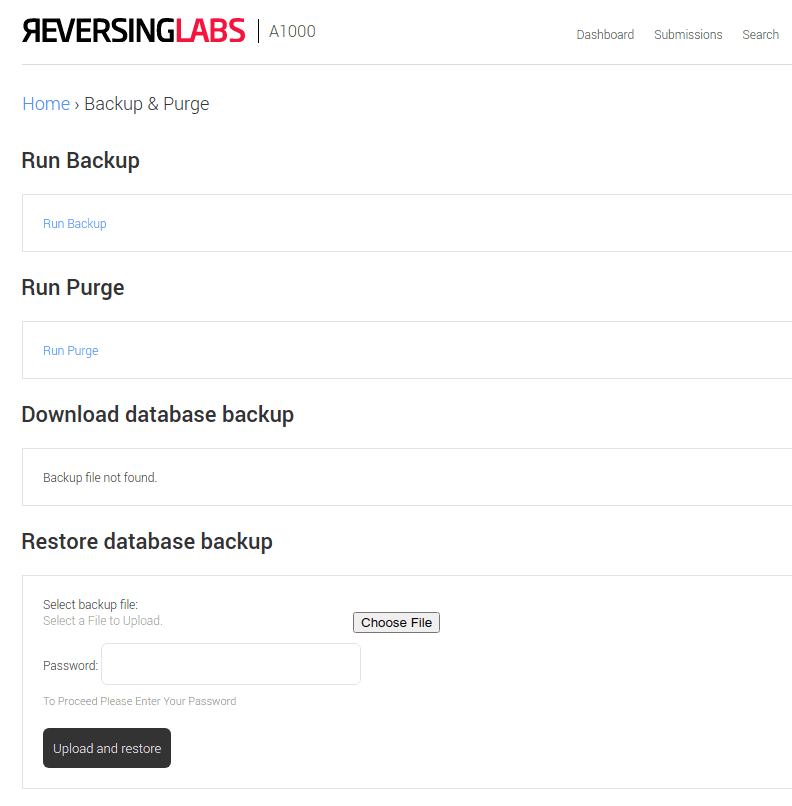
The Download database backup option on the Administration > Backup & Purge page allows users to download the database backup file and store it to a safe location or import it into a new Spectra Analyze instance. Only the latest database backup file can be downloaded using this option.
To import the database from an existing backup file, use the Restore database backup option. The dialog allows selecting a backup file to upload, and prompts for the user’s password (the same password used to log into the Spectra Analyze appliance).
Clicking the Upload and restore button will restart the appliance and import the uploaded database. The process takes several minutes, during which the maintenance page is displayed. Refresh it to return to the Spectra Analyze appliance interface.
Factory Reset
Performing the factory reset will revert the appliance to its default state and delete the appliance database data, including YARA rules saved to the disk.
Users must input their password and check the confirmation box before performing this action to ensure it is not done by accident.
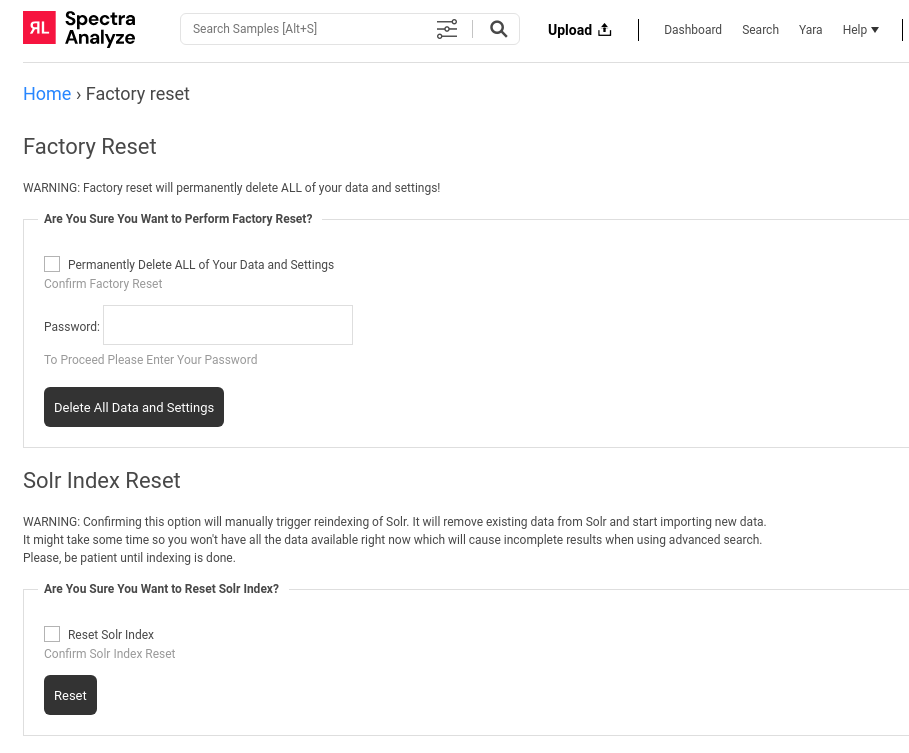
The following will be removed from the appliance when the Factory Reset action is confirmed:
- All samples
- All YARA rulesets except Spectra Core rulesets
- All user accounts created on the appliance
- All alerts collected on the appliance
- Custom configuration values modified by the appliance users
Solr Index Reset
The Advanced Search feature uses Solr to index the samples on the appliance and their metadata in order to include them in the search results.
Administrators can use the Solr index reset option to manually trigger reindexing of the data for the search engine. Selecting and confirming this option will remove the existing data from the search database and start importing new data into it.
Reindexing the database can be helpful to resolve potential issues with Advanced Search when restoring the appliance database from backups. However, the reindexing process can take a long time (depending on the amount of samples on the appliance). Until reindexing is complete, search results may not be accurate.
This option should be used for troubleshooting only when instructed to do so by ReversingLabs Support.
System Status
The System Status page shows the general health of the appliance. It also displays the internal build version, should that information be needed when interacting with ReversingLabs Support. The build version of the appliance and the version of Spectra Core, as well as the Download Logs button can be seen at the top right of the page.
For optimal system performance, ensure that System Services, Supervisor Services, External Services (primarily Spectra Detect Manager and Spectra Intelligence, if configured), system load and RabbitMQ queues operate normally. Other stats depend on which services and/or third party integrations are enabled on the appliance.
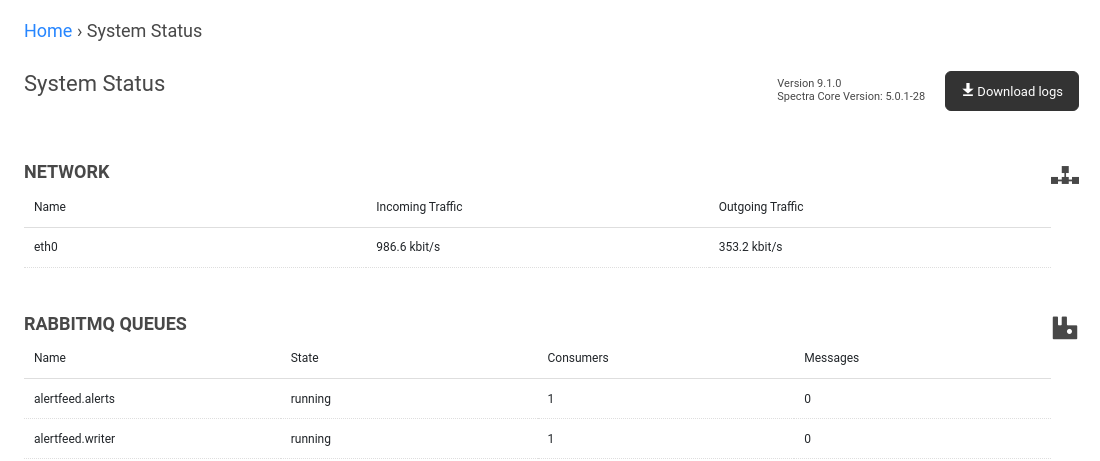
The Download Logs Button
The Download Logs button allows the user to download a support archive containing relevant system logs from the Spectra Analyze instance as a single file. The contents of the support archive downloaded this way are identical to the contents of the archive generated by running the tcbase support command directly from the console. The only difference between the two is that, when run, the tcbase support command may break up large log files.
During the processing, the button is disabled and updated to show the download icon followed by Retrieving logs…. When processing is done, the log file is downloaded to the user’s hard drive, while the button is renamed to Download Logs and reactivated. Users should not close the page or navigate away until the logs are created.
If needed, the user can then email the retrieved log file to RL support.
The System Status page is divided into the following sections.
Network
Network interfaces on the appliance and their current estimated transfer status (whether an interface is receiving and sending data). The displayed transfer rate is updated periodically, and might not capture peak traffic on the interface. To get the approximate traffic traversing through the network, multiply the numbers by 8.
Processing Queue
The status of the queues on the appliance used for processing newly uploaded samples, and for performing Local YARA Retroactive Hunting.
While a Local Retro scan is in progress, the appliance still continues to process newly uploaded samples. The processing priority is given to newly uploaded samples to prevent delays. The count value of the uploads processing queue should always be lower than the value of the local-retro queue.
RabbitMQ Queues
The status of the queues on the appliance used for background tasks, such as calls to Spectra Intelligence / T1000 APIs, Spectra Core processing requests, data collection/input, and more. The size of individual queues will vary and might reach low thousands.
This section helps to ensure that all queues are running, that they all have at least 1 consumer, and that the number of messages is not increasing. If that is not the case, especially if any of the queues show more than 100 000 messages, please contact ReversingLabs support.
Connectors
If any of the Connectors are enabled and configured on the appliance, this section indicates the status of each connector. Otherwise, this section is displayed as empty.
CPU, Disk Partitions and Memory
Current resource utilization on the appliance, showing general load, storage size, and storage usage. If there are any red icons, that means the system is under more load than it can handle, and the traffic needs to be partitioned.
In case of CPU and memory indicators showing a red icon, consider increasing the CPU and RAM parameters for the Spectra Analyze virtual machine.
If memory usage consistently goes over 75%, memory capacity should be increased.
Similarly, if storage usage goes over 75%, consider increasing the storage capacity.
System and Supervisor Services
Current state of the critical services on the appliance. Any failures shown here (with the red icon) mean the appliance is not functioning correctly and ReversingLabs Support should be notified.
Scale
A critical service for processing samples through Spectra Core. Any failures shown here (with the red icon) mean the appliance is not functioning correctly and ReversingLabs Support should be notified.
This section also allows users with the appropriate user roles to access the list of YARA rulesets with warnings. If there are any rulesets with warnings on the appliance, the YaraWarnings icon will not be green, and will show the number of warnings instead. Clicking the icon redirects to the YARA Hunting page filtered to display only rulesets with warnings. Here the offending rulesets can be edited or disabled to improve the processing speed of the appliance.
External Services Connectivity
Current state of the services that the appliance interacts with externally.
“SMTP” is the email service, typically for enabling password reset emails. “NTP” is the service for time server synchronization. “Spectra Intelligence” indicates the connectivity status for the Spectra Intelligence service.
If any of the services are showing a red icon, it typically means they are not enabled or not configured properly. Please check if the external services are operational, and make sure they are properly set up on the System Configuration page.
Dynamic analysis services supported by the appliance will also be listed here (ReversingLabs Cloud Sandbox and Auxiliary Analysis, Cuckoo, FireEye, Joe Sandbox, CAPE, Cisco Secure Malware Analytics, VMRay) with icons indicating their status (whether they are enabled and connected). These services can be configured on the integrations page.
If a dynamic analysis service is enabled and configured, the current number of files queued for analysis is shown here. Otherwise, this section will not be displayed. Configured services should show green icons.
Licensing
Appliance Licensing configuration screen.
Other Sections
📄️ Setup and Initial Configuration
Initial system configuration via console and GUI. Licensing and user settings.
📄️ Redundancy System
Configuring Spectra Analyze as a redundant cluster.
📄️ User Roles
How to configure user roles for Spectra Analyze users.
📄️ Connectors
Connector service configuration: Network Connector (File Share), Email Connectors (IMAP and SMTP), Storage Connectors (S3, Azure Data Lake)
📄️ System Updates
Update Spectra Analyze, either locally from a package file, or by downloading an update from Spectra Intelligence.
📄️ System Configuration
A list of all possible configuration fields in the Administration section of the appliance.
📄️ SNMP
SNMP trap tresholds and MIB descriptions.
📄️ System Alerting
System alerting, Connector alerts, CEF events
📄️ Configuration Management using Spectra Detect Manager
Configuring Spectra Analyze using a Spectra Detect Manager appliance.
📄️ Authentication
Authentication settings, LDAP, OAuth 2.0 / OpenID, SAML