File Preview / Visualization
There are several ways to preview a file:
- by clicking the “Preview / Visualizations” link in the persistent sample summary above the navigation sidebar
- from the Preview / Visualizations menu item in the sidebar
- by clicking the View HEX option in the actions menu (☰) for a file on the Extracted Files page
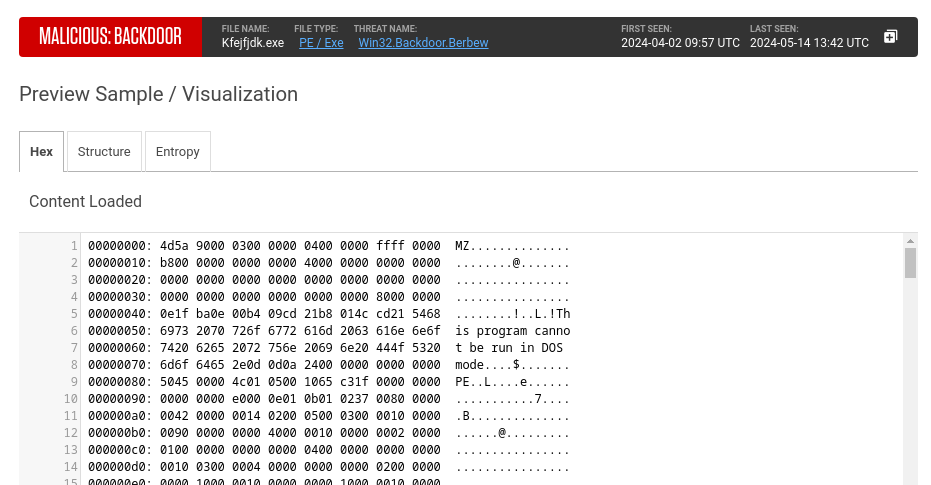
The file preview window contains three tabs: Hex, Structure and Entropy.
For samples that matched a YARA rule, the Hex tab displays a YARA Matches filter, allowing the users to see the exact parts of the file that matched a specific YARA rule. Matches can be filtered by ruleset, rule or matched value.
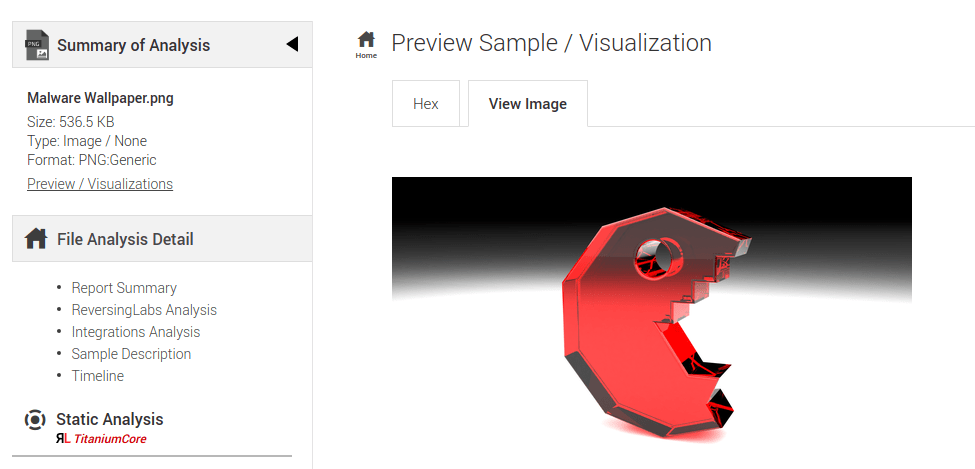
For supported image formats (PNG, JPG, GIF), an additional “View” will be present, allowing the users to preview the image. The appliance displays a warning message before allowing the image preview.
A similar principle applies for other supported file formats, such as text documents and some script languages, where the code is displayed and can be beautified in the “PREVIEW” tab.
The Entropy tab visualizes the amount of entropy per each section of the file. Entropy is used to express “randomness” of the data in a file, or to measure predictability of any character in the file based on preceding character distribution. It is measured in a scale of 1 to 8, where 8 indicates highest entropy (highest measure of randomness). Typical user data, such as text files, rarely exhibits true randomness. On the other hand, encrypted or compressed files have a high measure of entropy. Therefore, entropy can be used to detect encryption and compression in suspicious files.
The Structure tab visualizes the sections of a PE/PE+ file, such as PE header, Import table, and Overlay. It is possible to click the items in the list on the right (Virtual, Physical, Import table, Resource table…). Clicking an item redirects the user to the related section of the static analysis results (on the Spectra Core page).