Spectra Detect AWS EKS Microservices Deployment — Helm, KEDA, and RabbitMQ
Introduction
This document describes how to deploy and operate Spectra Detect on Kubernetes, using Amazon EKS as the reference platform.
Spectra Detect runs as a set of container images. A single umbrella Helm chart, detect-platform, installs them and packages the Kubernetes manifests and configuration into versioned releases, so installs, upgrades, and rollbacks are repeatable.
You configure the deployment through a values.yaml file that you create before installing the chart. It controls:
- Infrastructure components (Prometheus, PostgreSQL, RabbitMQ)
- Processing components (Worker)
- Integration components (S3 Connector, ICAP Connector)
- Management components (Spectra Detect Manager)
- Storage options (persistent volumes, ephemeral volumes)
- Scaling behavior (CPU-based, queue-based autoscaling)
- Integration settings (authentication, logging, monitoring)
The chart turns these values into ConfigMaps and Secrets, so you can change behavior without rebuilding images, and credentials are stored separately from the rest of the configuration.
When KEDA is installed, Worker components scale their replica counts automatically, based on CPU utilization or on the length of their RabbitMQ queue.
The Configuration Reference documents every available configuration option.
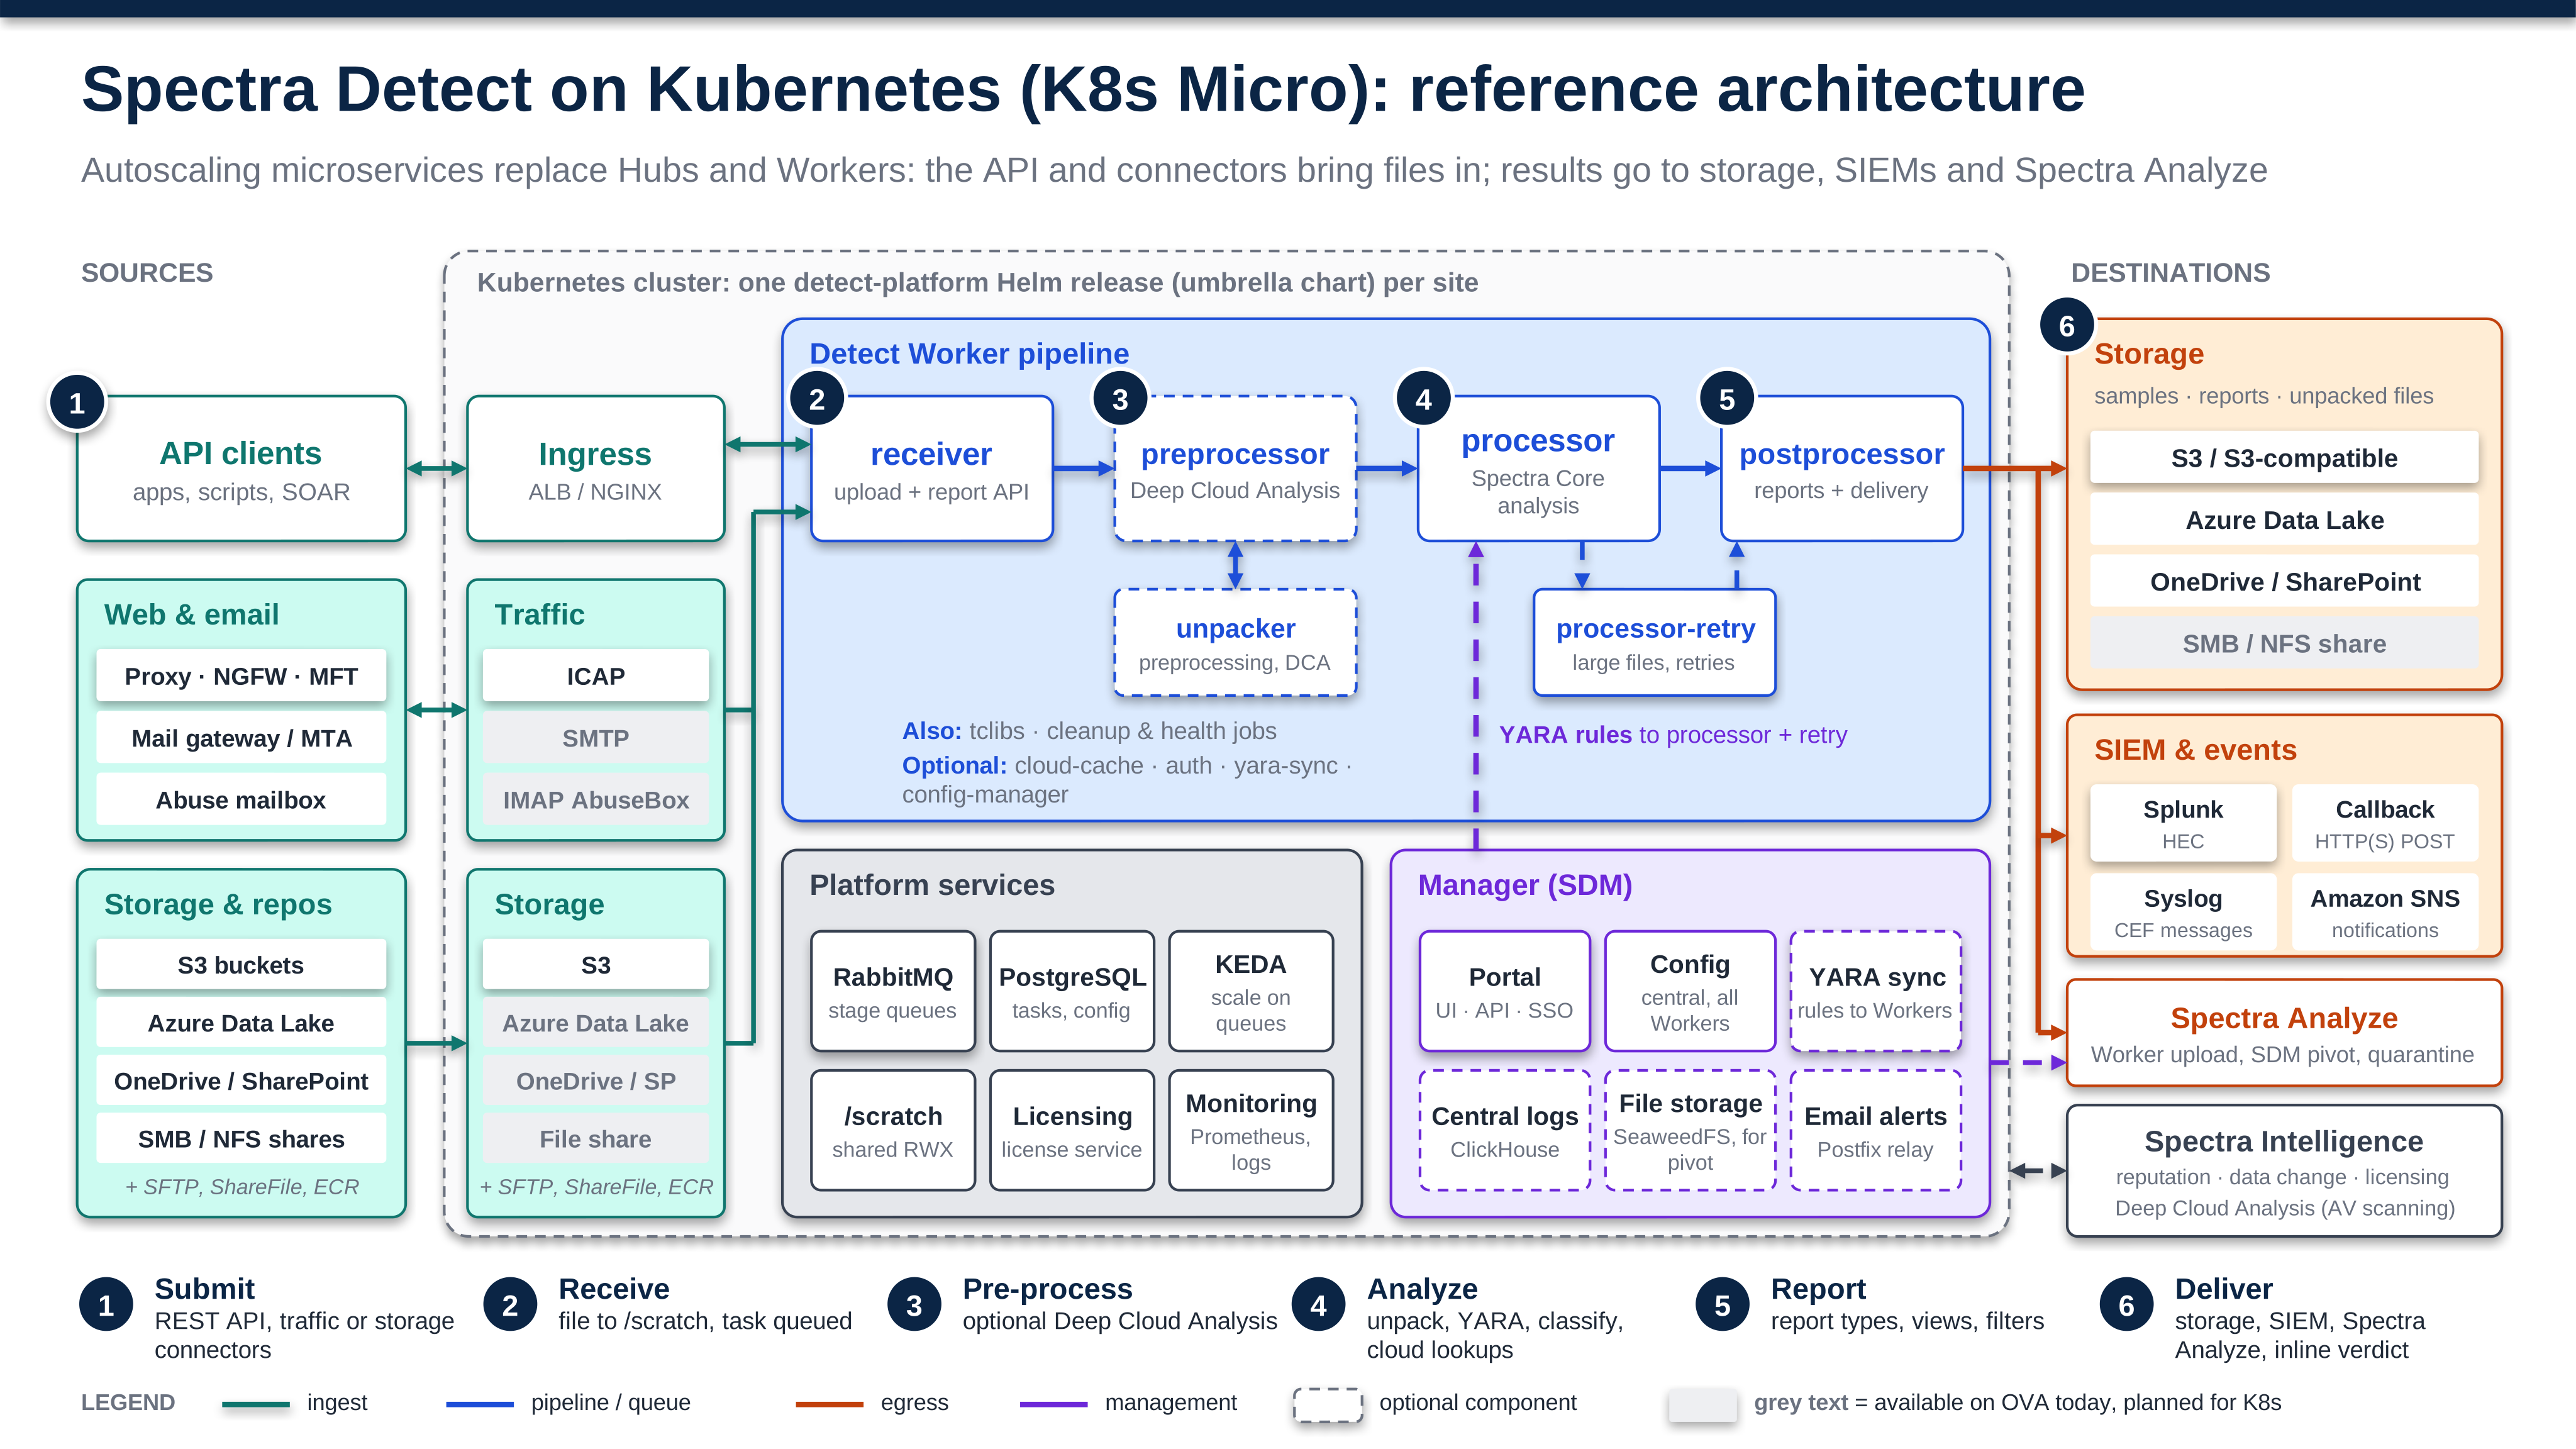
Spectra Detect microservices architecture on Kubernetes
The diagram shows how files move through a Spectra Detect microservices deployment, from sources such as API clients, traffic, and storage connectors, through the Worker pipeline, to destinations such as storage, SIEMs, and Spectra Analyze.
Requirements
- EKS version 1.34, Amazon Linux 2023 with cgroupsv2 (tested)
PersistentVolumeprovisioner supportingReadWriteMany(for example, the Amazon EFS CSI driver)PersistentVolumeprovisioner supportingReadWriteOnce(for example, the Amazon EBS CSI driver with agp2orgp3storage class)- Ingress controller (AWS Load Balancer Controller or nginx)
- Helm 3.8 or later (required for pulling charts from OCI registries)
Before You Begin
Before deploying Spectra Detect, you must install the required infrastructure components on your EKS cluster. Complete the following prerequisites in order:
1. Install Storage Drivers
Required: Install the Amazon EFS CSI Driver for shared storage support.
- Follow the Amazon EFS CSI Driver installation guide
- Create an EFS file system and configure mount targets
- Create a storage class for EFS (see Amazon EFS Remote Storage for detailed instructions)
Required: Install the Amazon EBS CSI Driver for ReadWriteOnce volumes.
- Follow the Amazon EBS CSI Driver installation guide. EKS can't provision EBS volumes without it, even when a
gp2storage class is already listed in the cluster. - Check which storage classes exist with
kubectl get storageclass. To usegp3, create a storage class for it with theebs.csi.aws.comprovisioner.
2. Install Kubernetes Operators
Install the following operators based on your deployment configuration:
If using autoscaling (recommended):
- Install KEDA for horizontal pod autoscaling based on CPU utilization and queue length
If deploying RabbitMQ with the Helm chart (rabbitmq.host left empty):
- Install the RabbitMQ Cluster Operator, using the command in the RabbitMQ Broker section
If deploying PostgreSQL with the Helm chart (postgres.host left empty):
- Install the CloudNativePG Operator, using the command in the PostgreSQL Server section
Note: If you plan to use external RabbitMQ or PostgreSQL services (e.g., Amazon MQ, Amazon RDS), set rabbitmq.host and postgres.host to those services. The chart then skips creating the in-cluster clusters and you do not need to install these operators.
3. Install Monitoring Components (Optional)
If using Prometheus monitoring (worker.monitoring.enabled: true):
- Install the Prometheus Operator
- Follow the Deploying Prometheus instructions
Note that the top-level prometheus.enabled value defaults to true, but it only creates the configuration and secrets other charts use to connect to Prometheus. It does not deploy Prometheus itself, so it does not by itself require the Prometheus Operator.
4. Install Ingress Controller
Required: Install an Ingress Controller to expose Spectra Detect endpoints.
Choose one of the following:
- AWS Load Balancer Controller (recommended for AWS EKS)
- Ingress-NGINX Controller
5. Optional: Install External DNS
If you want automatic DNS record creation in AWS Route53:
- Install External DNS
6. Optional: Configure EKS Pod Identity
If the S3 Connector or the Worker will access S3 buckets without long-lived access keys, set up the IAM role and Pod Identity association beforehand. See Pod Identity.
7. Choose a Licensing Method
Required: The Worker doesn't process files until Spectra Detect is licensed. Its readiness check fails, and the receiver reports the deployment as unlicensed. Unlike Spectra Detect virtual appliances, a Kubernetes deployment has no trial period and no machine ID.
The chart always deploys a licensing component. License it in one of the following ways:
- Spectra Intelligence: the licensing component activates with a Spectra Intelligence account, the same
u/company/useraccount you use for the registry. This is the standard method for Kubernetes deployments. If the component can't reach Spectra Intelligence, the deployment keeps working for a 14-day grace period. - License file: if you can't use Spectra Intelligence, request a time-based license file from ReversingLabs Support. The licensing component reads the file (
rl.lic) from a Kubernetes secret.
You set up licensing in step 4 of Deploying Detect using Helm Charts. The Licensing Configuration Reference lists every licensing option, including a proxy for the Spectra Intelligence connection.
Prerequisites Checklist
Use this checklist to verify you have completed all required prerequisites:
- EFS CSI Driver installed
- EFS file system created with storage class configured
- EBS CSI Driver installed and a
gp2orgp3storage class available - KEDA installed (if using autoscaling)
- RabbitMQ Operator installed (if deploying RabbitMQ with chart)
- CloudNativePG Operator installed (if deploying PostgreSQL with chart)
- Prometheus Operator installed (if using monitoring)
- Ingress Controller installed (AWS ALB or nginx)
- External DNS installed (optional, for automatic DNS management)
- EKS Pod Identity configured (optional, for keyless S3 access)
- Spectra Intelligence account ready for licensing, or a time-based license file from ReversingLabs Support
Once all required prerequisites are in place, continue with Getting Started.
Getting Started
Spectra Detect Helm charts and container images are hosted at registry.reversinglabs.com. You sign in to the registry with your Spectra Intelligence account.
Setting Up Registry Access
-
Set the variables that the commands on this page use:
export RELEASE_NAME="detect" # Helm release name, max 30 charactersexport NAMESPACE="detect" # Kubernetes namespace for Spectra Detectexport DETECT_HELM_CHART_VERSION="7.0.0-3" # Chart version, see step 3export SPECTRA_INTELLIGENCE_USERNAME="u/company/user"read -rs SPECTRA_INTELLIGENCE_PASSWORD && export SPECTRA_INTELLIGENCE_PASSWORD -
Sign in to the registry:
echo "${SPECTRA_INTELLIGENCE_PASSWORD}" | helm registry login registry.reversinglabs.com \-u "${SPECTRA_INTELLIGENCE_USERNAME}" --password-stdin -
Optional: list the chart versions available in the registry with a tool like Skopeo:
echo "${SPECTRA_INTELLIGENCE_PASSWORD}" | skopeo login registry.reversinglabs.com \-u "${SPECTRA_INTELLIGENCE_USERNAME}" --password-stdinskopeo list-tags docker://registry.reversinglabs.com/detect/charts/detect-suite/detect-platformExample output:
{"Repository": "registry.reversinglabs.com/detect/charts/detect-suite/detect-platform","Tags": ["7.0.0-3"]}
Deploying Detect using Helm Charts
-
Create a namespace or use an existing one
kubectl create namespace "${NAMESPACE}" -
Create a
values.yamlconfiguration fileCreate the
values.yamlfile that defines your deployment configuration. You can start with a minimal configuration and expand it based on your requirements. The Configuration Reference provides detailed information about all available options.Example minimal
values.yamlstructure:# Registry configurationregistry:createRegistrySecret: trueauthSecretUsername: "your-username"authSecretPassword: "your-password"# Worker configurationworker:enabled: true# Each Worker component has its own autoscaling toggle. KEDA must be installed# for autoscaling to work. Disable per component below if KEDA is not present;# there is no single `worker.autoscaling.enabled` switch.receiver:autoscaling: { enabled: false }tclibs:autoscaling: { enabled: false }processor:autoscaling: { enabled: false }processorRetry:autoscaling: { enabled: false }postprocessor:autoscaling: { enabled: false }preprocessor:autoscaling: { enabled: false }preprocessorUnpacker:autoscaling: { enabled: false }report:autoscaling: { enabled: false }persistence:# This storage class MUST match the EFS storage class created in the Prerequisites stepstorageClassName: "efs-sc"requestStorage: "100Gi"ingress:enabled: trueclassName: albhost: detect-platform-worker.example.comannotations:# Setting any annotation replaces all of the chart's default ALB annotations,# so the health check path must be set here too. Without it, the ALB checks "/"# and marks the Worker targets unhealthy.# See "Configure Ingress Controller" below for HTTPS and the full annotation set.alb.ingress.kubernetes.io/scheme: internalalb.ingress.kubernetes.io/target-type: ipalb.ingress.kubernetes.io/healthcheck-path: /livez# RabbitMQ configuration.# Leave host empty to have the chart deploy a RabbitMQ cluster (requires the# RabbitMQ Cluster Operator). Set host to use an external broker such as# Amazon MQ; the in-cluster cluster is then not created.# The chart creates the RabbitMQ user with a default password unless you set# username and password here, or provide your own secret (see RabbitMQ Broker).rabbitmq:host: ""username: "detect"password: "change-me"persistence:storageClassName: "gp2"requestStorage: "5Gi"# PostgreSQL configuration.# Leave host empty to have the chart deploy a PostgreSQL cluster (requires the# CloudNativePG Operator). Set host to use an external server such as Amazon RDS;# the in-cluster cluster is then not created.# The same applies to the PostgreSQL user (see PostgreSQL Server).postgres:host: ""username: "detect"password: "change-me"persistence:storageClassName: "gp2"requestStorage: "5Gi"# Licensing (see step 4). This example uses Spectra Intelligence;# the account credentials go into a secret in step 4.licensing:configuration:cloud:enabled: true# The S3 Connector is opt-in. connectorS3.enabled defaults to false;# set it to true and configure connectorS3.configuration.inputs to ingest from S3 buckets.infoThe minimal example uses
detect-platform-worker.example.comas a placeholder host. Without External DNS, the hostname will not resolve automatically: read the ALB DNS name fromkubectl get ingress -n "${NAMESPACE}"and either point a CNAME at it or use the ALB DNS name directly.The minimal example also leaves the Worker API without authentication and serves it over plain HTTP on port 80, reachable by anything inside the VPC. Before you send production traffic, enable
worker.configuration.authentication.enabledand add HTTPS as shown in step 6, Configure Ingress Controller.For production deployments, review the following sections to configure additional components:
- Prometheus Configuration for monitoring
- RabbitMQ Broker for message queuing
- PostgreSQL Server for database
- Storage for persistent and ephemeral volumes
- Ingress Controller configuration (see step 6 below) for external access
-
Set up the Registry Secret to allow Kubernetes to pull container images and Helm charts
The Kubernetes secret
rl-registry-keycontaining the user's Spectra Intelligence credentials needs to be created in the namespace where Detect will be installed. Secret needs to be of typekubernetes.io/dockerconfigjson. The pods and the upgrade Jobs use the same secret, so it must give access to the registry that hosts both the images and the Helm charts.3.1. The secret can either be created via Detect Helm chart
Configure the following values in your
values.yamlfile:registry.createRegistrySecret: needs to be set totrue(default)registry.authSecretUsername: value needs to be the Spectra Intelligence account usernameregistry.authSecretPassword: value needs to be the Spectra Intelligence account password
warningUse creation of secrets with Helm Charts for convenience or testing only. Do not store sensitive credentials in configuration files that are committed to Git. For production environments, use a dedicated secret management solution such as Sealed Secrets, External Secrets, or HashiCorp Vault.
3.2. Can be managed outside the Helm release
registry.createRegistrySecret: needs to be set tofalse
You can create the secret manually by using the following command:
kubectl apply -n "${NAMESPACE}" -f - <<EOFapiVersion: v1kind: Secretmetadata:name: "rl-registry-key"type: kubernetes.io/dockerconfigjsondata:.dockerconfigjson: $(echo -n '{"auths": {"registry.reversinglabs.com": {"auth": "'$(echo -n "${SPECTRA_INTELLIGENCE_USERNAME}:${SPECTRA_INTELLIGENCE_PASSWORD}" | base64)'"}}}' | base64 | tr -d '\n')EOFTo use a different secret name, set
registry.authSecretNameto it, and for the Worker, SDM and its subcharts, licensing, and any connectors you use, set everyimagePullSecretsvalue in the chart to the same name. -
Set up licensing
The licensing component needs one secret, depending on the method you chose in Choose a Licensing Method.
4.1. Spectra Intelligence
Set
licensing.configuration.cloud.enabledtotruein yourvalues.yamlfile, and create a secret of typekubernetes.io/basic-authwith the account credentials:kubectl create secret generic "${RELEASE_NAME}-secret-licensing-cloud" -n "${NAMESPACE}" \--type=kubernetes.io/basic-auth \--from-literal=username="${SPECTRA_INTELLIGENCE_USERNAME}" \--from-literal=password="${SPECTRA_INTELLIGENCE_PASSWORD}"Alternatively, the chart can create the secret: set
licensing.secrets.cloud.createUserSecrettotrueand fill inlicensing.secrets.cloud.usernameandlicensing.secrets.cloud.password. To use a different secret name, setlicensing.secrets.cloud.customSecretName.4.2. License file
Use this method only with a time-based license file from ReversingLabs Support. Leave
licensing.configuration.cloud.enabledat its default,false, and create a secret that holds the license file under the keyrl.lic:kubectl create secret generic "${RELEASE_NAME}-secret-license" -n "${NAMESPACE}" \--from-file=rl.lic=./rl.licAlternatively, the chart can create the secret: set
licensing.secrets.license.createUserSecrettotrueand setlicensing.secrets.license.base64to the Base64-encoded license file. To use a different secret name, setlicensing.secrets.license.customSecretName.warningUntil the secret for the chosen method exists, the licensing pod stays in the
ContainerCreatingstate.To check the license after the deployment is running, see License appliances in the Usage API.
-
Install the Spectra Detect Chart
Run the following command. The release name in
RELEASE_NAMEcan be at most 30 characters long.helm install "${RELEASE_NAME}" oci://registry.reversinglabs.com/detect/charts/detect-suite/detect-platform \--version "${DETECT_HELM_CHART_VERSION}" --namespace "${NAMESPACE}" -f values.yamlThe
values.yamlfile you created in step 2 is used to configure the deployment.Verify the deployment: Wait for the images to pull and the containers to start, then check that the components are running:
# Watch pods until they reach the Running statekubectl get pods -n "${NAMESPACE}" -w# Wait for the receiver deployment to finish rolling outkubectl rollout status deployment/"${RELEASE_NAME}"-wrk-receiver -n "${NAMESPACE}" --timeout=5m# Check the receiver liveness endpoint through a port-forwardkubectl port-forward -n "${NAMESPACE}" svc/"${RELEASE_NAME}"-wrk-receiver 8080:80 &curl -fsS http://localhost:8080/livezThe Worker Ingress routes only
/api/paths, so/livezisn't reachable through the Ingress hostname. To check the ALB itself, confirm that its targets are healthy in the EC2 console under Target Groups.For more details regarding values, please reference the Configuration Reference.
-
Configure Ingress Controller
In order to be able to access Spectra Detect endpoints from outside the cluster, and in order for Worker pod to be able to connect to the Spectra Detect Manager, an Ingress Controller (like AWS ALB or Nginx Controller) must be configured on the K8s cluster. Follow the official installation guides for the controllers:
noteThe Worker Ingress is sufficient for the minimal example. The additional SDM and Grafana Ingresses described in this section are only required when
global.sdmEnabled: trueorlogging.enabled: true.This example shows how to configure Ingress for Worker pod using AWS ALB Controller and how to use External DNS to automatically create DNS records in AWS Route53.
Add the following configuration to your
values.yamlfile. If the chart is already installed, apply the change withhelm upgrade(see Updating Detect using Helm Charts).worker:ingress:annotations:alb.ingress.kubernetes.io/backend-protocol: HTTPalb.ingress.kubernetes.io/certificate-arn: <<AWS CERTIFICATE ARN>>alb.ingress.kubernetes.io/group.name: detectalb.ingress.kubernetes.io/healthcheck-interval-seconds: "15"alb.ingress.kubernetes.io/healthcheck-path: /livezalb.ingress.kubernetes.io/healthcheck-port: "80"alb.ingress.kubernetes.io/healthcheck-protocol: HTTPalb.ingress.kubernetes.io/healthcheck-timeout-seconds: "5"alb.ingress.kubernetes.io/healthy-threshold-count: "2"alb.ingress.kubernetes.io/load-balancer-attributes: idle_timeout.timeout_seconds=600alb.ingress.kubernetes.io/manage-backend-security-group-rules: "true"alb.ingress.kubernetes.io/scheme: internal# Replace <<AWS_SECURITY_GROUPS>> with a comma-separated list of SG IDs,# or remove this annotation if not using manage-backend-security-group-rules.alb.ingress.kubernetes.io/security-groups: <<AWS_SECURITY_GROUPS>>alb.ingress.kubernetes.io/ssl-policy: ELBSecurityPolicy-FS-1-2-Res-2020-10alb.ingress.kubernetes.io/success-codes: 200,301,302,404alb.ingress.kubernetes.io/target-group-attributes: stickiness.enabled=true,stickiness.lb_cookie.duration_seconds=1200alb.ingress.kubernetes.io/target-type: ipalb.ingress.kubernetes.io/unhealthy-threshold-count: "2"external-dns.alpha.kubernetes.io/hostname: detect-platform-worker.example.comexternal-dns.alpha.kubernetes.io/ingress-hostname-source: annotation-onlyclassName: albenabled: truehost: detect-platform-worker.example.comAdditionally, two more Ingresses are used if Logging and SDM are deployed:
- Ingress for Grafana
- Ingress for SDM
They can be configured similarly to the worker ingress.
When the Worker is running, submit a file to test it. See Upload file for processing.
Updating Detect using Helm Charts
Before running the upgrade, you can use the helm diff upgrade command to see the changes that will occur in the Kubernetes manifest files. The Helm Diff plugin must be installed to use the diff command. You can install Helm Diff using the following command:
# Install plugin
helm plugin install https://github.com/databus23/helm-diff

# Run diff command
helm diff upgrade "${RELEASE_NAME}" oci://registry.reversinglabs.com/detect/charts/detect-suite/detect-platform \
  --version "${DETECT_HELM_CHART_VERSION}" \
  --namespace "${NAMESPACE}" \
  -f values.yaml

# Check the Helm chart readme beforehand if you want
helm show readme oci://registry.reversinglabs.com/detect/charts/detect-suite/detect-platform --version "${DETECT_HELM_CHART_VERSION}"

# Run upgrade
helm upgrade "${RELEASE_NAME}" oci://registry.reversinglabs.com/detect/charts/detect-suite/detect-platform \
  --version "${DETECT_HELM_CHART_VERSION}" \
  --namespace "${NAMESPACE}" \
  -f values.yaml
Migrating old S3 and registry settings
S3 settings aren't migrated automatically. Don't upgrade with --reuse-values. It keeps the old S3 and registry values from the current release, and the charts reject them.
-
Export the values of your current release:
helm get values "${RELEASE_NAME}" -n "${NAMESPACE}" -o yaml > values.yaml -
Define each S3 connection under
global.s3Connectionsand each ARN role underglobal.arnProfiles:global:s3Connections:connection-1:region: "us-east-1"secrets:credentials:customSecretName: "my-s3-secret"arnProfiles:ap-1:enableArn: trueroleArn: "arn:aws:iam::123456789012:role/MyRole"externalRoleId: "my-role-id" -
Move the S3 connection and ARN role settings to the connections and ARN profiles, and reference them with
connectionNameandarnProfileNameinstead.-
Worker: settings from
worker.configuration.awsmove to the connection, and settings fromworker.configuration.awsRolemove to the ARN profile, under the same names. Instead ofcaPath, paste the contents of the certificate file into the connection'scertificate. -
S3 connector inputs: settings move to the connection or the ARN profile under new names:
Input setting New setting zoneConnection regionendpointConnection endpointUrlverifySslCertificateConnection sslVerifyawsEnableArnARN profile enableArnawsRoleArnARN profile roleArnawsExternalRoleIdARN profile externalRoleIdawsRoleSessionNameARN profile roleSessionNameawsArnTokenDurationARN profile tokenDuration -
Credentials: credential secrets don't carry over. Set each connection's credentials in
secrets.credentials, either as an existing secret withcustomSecretName, or withcreateUserSecret: true,awsS3AccessKeyId, andawsS3SecretAccessKeyfor the chart to create one. -
Connections per output bucket:
bucketS3ConnectionMappinginworker.configuration.s3andworker.configuration.reportS3is now a map instead of a list:worker:configuration:s3:bucketS3ConnectionMapping:"bm-conn-1":connectionName: "connection-1"arnProfileName: "ap-1"buckets:- output-1
-
-
Remove
registry.createRegistryCredentialsSecret,global.registryCredentialsCustomSecretName,worker.registry.customSecretName, andsdm.sdmPortal.registry.customSecretName. -
Upgrade with the updated file, as described in Updating Detect using Helm Charts. If Helm reports
Additional property <key> is not allowed, move that key as described in step 3, or remove it if it's a registry setting from step 4.
Uninstalling Detect
helm uninstall "${RELEASE_NAME}" -n "${NAMESPACE}"
Operators and Tools
KEDA (autoscaling - optional)
For Spectra Detect to autoscale Workers, KEDA needs to be installed on the cluster. KEDA can be deployed following the official Deploying KEDA documentation. It is not required to have KEDA installed to run Spectra Detect on K8s, but it is required to utilize Worker autoscaling features.
Prometheus Operator
All Worker and Integration pods have metrics exposed in Prometheus format.
There is a Prometheus chart which can be deployed with umbrella. This chart is strictly configuration chart, it creates necessary resources to allow other components to connect with Prometheus. It does not deploy the Prometheus server itself, for that a separate Prometheus instance needs to be deployed. If Prometheus instance is not already present in the cluster, steps from the Deploying Prometheus section can be used to deploy it.
Prometheus Configuration
To use Prometheus with Spectra Detect, you need to configure the following values:
# Configures Prometheus monitoring for Worker pods
worker:
  monitoring:
    # -- Enable/disable monitoring with Prometheus
    enabled: true
    # -- Use actual release name
    prometheusReleaseName: "${PROMETHEUS_RELEASE_NAME}"

# Configures Prometheus monitoring for Integration pods
connectorS3:
  monitoring:
    # -- Enable/disable monitoring with Prometheus.
    enabled: false
    # -- Prometheus release name.
    prometheusReleaseName: "${PROMETHEUS_RELEASE_NAME}"

# Create necessary resources for Prometheus integration in other components (SDM)
prometheus:
  enabled: true
  releaseName: "${PROMETHEUS_RELEASE_NAME}"
  namespace: "${PROMETHEUS_NAMESPACE}"
Additional information about configuration values for Prometheus chart can be found Prometheus Configuration Reference.
Deploying Prometheus
To deploy Prometheus, you can use the official Prometheus Helm chart. The chart can be found here.
- Add the Prometheus community repository:
helm repo add prometheus-community https://prometheus-community.github.io/helm-charts
helm repo update
- Run the following command to deploy the chart in your cluster:
# Set release name and namespace
HELM_RELEASE_NAME="kube-prometheus-stack"
PROMETHEUS_NAMESPACE="monitoring"

# Install the kube-prometheus-stack chart
helm install "$HELM_RELEASE_NAME" --create-namespace --namespace "$PROMETHEUS_NAMESPACE" -f prometheus-custom-values.yaml \
  prometheus-community/kube-prometheus-stack
The file prometheus-custom-values.yaml contains custom configuration for the Prometheus chart.
Example of the content of prometheus-custom-values.yaml:
prometheus:
  prometheusSpec:
    # Monitor all namespaces
    serviceMonitorNamespaceSelector: { }
    podMonitorNamespaceSelector: { }
    podMetadata:
      labels:
        app.kubernetes.io/name: prometheus
        app.kubernetes.io/component: prometheus
        app.kubernetes.io/part-of: detect

# Disable Grafana since we deploy it separately
grafana:
  enabled: false

# Allow kube-state-metrics to expose these labels in kube_pod_labels
kube-state-metrics:
  extraArgs:
    - >-
      --metric-labels-allowlist=pods=[
      app.kubernetes.io/component,
      app.kubernetes.io/name,
      app.kubernetes.io/part-of,
      app.kubernetes.io/version,
      reversinglabs.com/image-tag,
      app.kubernetes.io/instance,
      helm.sh/chart
      ]
RabbitMQ Broker
Spectra Detect Helm charts support using external RabbitMQ Brokers (like AmazonMQ), as well as deploying and using RabbitMQ cluster resources as part of a Detect deployment installed in the same namespace. Choose which option to use based on the business requirements.
-
External RabbitMQ Broker (deployed and managed outside of Spectra Detect Helmcharts)
External/existing RabbitMQ Broker needs to be set up as per the broker installation guides. As an example, please check the Amazon MQ instructions.
-
RabbitMQ Operator (deployed and managed by Spectra Detect Helm charts)
Cloud native brokers can be deployed and managed by Spectra Detect Helm charts. RabbitMQ Operator needs to be installed in the K8s cluster.
kubectl apply --wait -f \
  https://github.com/rabbitmq/cluster-operator/releases/download/v2.6.0/cluster-operator.yml
| Secret (when custom secret name is used) | Secret (default secret name) | Type | Description |
|---|---|---|---|
<global.rabbitmqCustomSecretName> | <release_name>-rabbitmq-secret | required | Basic authentication secret which contains the RabbitMQ username and password. Secret is either created manually (rabbitmq chart) or already exists. |
<global.rabbitmqAdminCustomSecretName> | <release_name>-rabbitmq-secret-admin | optional | Basic authentication secret which contains the RabbitMQ Admin username and password. Secret is either created manually (rabbitmq chart) or already exists. If missing, credentials from <release_name>-rabbitmq-secret are used. |
For Detect application to work properly, the following vhosts are needed and will be created on deploy if missing:
- Vhost for Worker Processing
- Vhost for SDM
- Vhost for Central Logging
All vhost names can be configured; otherwise, the default names will be used.
View the RabbitMQ Configuration Reference for more information about the configuration options.
PostgreSQL Server
Spectra Detect Helm charts support using external PostgreSQL Clusters (like Amazon RDS), as well as deploying and using PostgreSQL cluster resources as part of a Detect deployment.
-
External PostgreSQL Server (deployed and managed outside of Spectra Detect Helm charts)
External/existing PostgreSQL server needs to be set up as per the PostgreSQL server guide. As an example, please check the Amazon RDS instructions
-
CloudNativePG Operator (deployed and managed by Spectra Detect Helm charts)
CloudNativePG Operator needs to be installed in the K8s cluster.
# PostgreSQL Operator - CloudNativePG (CNPG)
kubectl apply --wait -f \
  https://raw.githubusercontent.com/cloudnative-pg/cloudnative-pg/release-1.21/releases/cnpg-1.21.1.yaml
| Secret (when custom secret name is used) | Secret (deployment with Detect chart) | Type | Description |
|---|---|---|---|
<global.postgresCustomSecretName> | <release_name>-postgres-secret | required | Basic authentication secret which contains the database username and password. Secret is either created manually (postgres chart) or already exists. |
For Detect application to work properly, the database and schema are needed and will be created on deploy if missing. Schema is used for SDM component.
Database and schema names can be configured; otherwise default names will be used.
View the PostgreSQL Configuration Reference for more information about the configuration options.
Reloader
Secret and ConfigMap changes in SDM subcharts are handled by Reloader (https://github.com/stakater/Reloader). This is a Kubernetes controller that watches changes in ConfigMap and Secrets and does rolling upgrades on Pods with their associated Deployment, StatefulSet, DaemonSet and DeploymentConfigs.
Reloader is currently only applicable for SDM components. Worker components have internal mechanisms for applying configuration changes.
Deploy Reloader
Reloader can be deployed with the umbrella chart if needed.
- Add the Reloader Helm chart repository:
    helm repo add stakater https://stakater.github.io/stakater-charts
    helm repo update
- Deploy the Reloader with the umbrella chart by setting
reloader.enabledtotrue. Currently, it is deployed by default.
View the Reloader Configuration Reference for more information about the configuration options of the Reloader deployed by the umbrella chart.
Reloader Usage
To actually use the Reloader to automatically apply changes to Secrets and ConfigMaps, the global.useReloader flag must be set to true.
If global.useReloader is set to false, changes to Secrets and ConfigMaps from SDM components will not be automatically applied.
Additionally, Reloader can be configured for specific SDM components with useReloader value, which will override the global.useReloader setting.
If Reloader is disabled, a manual rollout restart must be performed:
kubectl rollout restart deployment <deployment-name>

kubectl rollout restart statefulset <statefulset-name>
Storage
Persistent volume
There are multiple persistent volumes used by the Detect components:
-
RabbitMQ (if deployed)
If RabbitMQ is deployed with the umbrella chart, it will use a persistent volume to store message data.
The requested access mode is
ReadWriteOnce, and any type of storage that supports that can be used (e.g. in AWS encrypted-gp2).Example of configuration:
rabbitmq:persistence:storageClassName: "gp2"requestStorage: "5Gi" -
Postgres (if deployed)
If Postgres is deployed with the umbrella chart, it will use a persistent volume to store data.
The requested access mode is
ReadWriteOnce, and any type of storage that supports that can be used (e.g. in AWS encrypted-gp2).Example of configuration:
postgres:persistence:storageClassName: "gp2"requestStorage: "5Gi" -
Worker
The
/scratchfolder is implemented as a persistent volume. Multiple services have access to the volume:- Cleanup
- Health Check
- Preprocessor
- Processor (Standard, Retry and Preprocessor Unpacker)
- Postprocessor
- Receiver
- TcLibs
- Connector S3 (if deployed with sharedStorage enabled)
Since multiple services (pods) are accessing the volume, the access mode of that volume has to be
ReadWriteMany. In AWS, it is recommended to use EFS storage since it supports the requested access for pods. (More information can be found here)Example of configuration:
worker:persistence:storageClassName: "efs-sc"requestStorage: "100Gi" -
Connector S3 (if deployed)
If Connector S3 is deployed, it will use a persistent volume for BoltDB.
The requested access mode is
ReadWriteOnce, and any type of storage that supports that can be used (e.g. in AWS encrypted-gp2).This volume can be configured in the following way:
connectorS3:persistence:storageClassName: "gp2"requestStorage: "5Gi"If deployed with sharedStorage enabled, the Connector S3 will use a persistent volume created in Worker to store data (
/scratchfolder). -
SeaweedFS (if deployed)
If SeaweedFS is deployed with the umbrella chart, it will use a persistent volume for data storage.
The requested access mode is
ReadWriteOnce, and any type of storage that supports that can be used (e.g. in AWS encrypted-gp2).Example of configuration:
seaweedfs:persistence:storageClassName: "gp2"requestStorage: "50Gi" -
ClickHouse (if deployed)
If ClickHouse is deployed with the umbrella chart, it will use a persistent volume for data storage.
The requested access mode is
ReadWriteOnce, and any type of storage that supports that can be used (e.g. in AWS encrypted-gp2).Example of configuration:
clickhouse:persistence:storageClassName: "gp2"requestStorage: "20Gi" -
Loki (if deployed)
If Loki is deployed with the umbrella chart, it will use a persistent volume for data storage. If persistent storage is not enabled it will use
emptyDir.The requested access mode is
ReadWriteOnce, and any type of storage that supports that can be used (e.g. in AWS encrypted-gp2).Example of configuration:
logging:loki:persistence:enabled: truestorageClass: "gp2"size: "30Gi" -
Grafana (if deployed)
If Grafana is deployed with the umbrella chart, it will use a persistent volume for data storage. If persistent storage is not enabled it will use
emptyDir.The requested access mode is
ReadWriteOnce, and any type of storage that supports that can be used (e.g. in AWS encrypted-gp2).Example of configuration:
logging:grafana:persistence:enabled: truestorageClass: "gp2"size: "1Gi"
Ephemeral volume
There are multiple ephemeral volumes used by the Detect components:
-
Connector S3 (if deployed)
If Connector S3 is deployed and sharedStorage is not used, it will use an ephemeral volume for temporary storage of files downloaded from S3.
The requested access mode is
ReadWriteOnce, and any type of storage that supports that can be used (e.g. in AWS encrypted-gp2).The storage class name is empty by default (value
tmp.storageClassName). If not overridden,emptyDirwill be used for storage.Example of configuration:
connectorS3:tmp:storageClassName: "gp2"requestStorage: "10Gi" -
Worker
The
/tc-scratchfolder is used as an ephemeral volume for temporary processing files in the following processing components:- Processor
- Retry Processor
- Preprocessor Unpacker Each component has its own ephemeral volume, but the configuration is shared.
The requested access mode is
ReadWriteOnce, and any type of storage that supports that can be used (e.g. in AWS encrypted-gp2).The storage class name is empty by default (value
tcScratch.storageClassName). If not overridden,emptyDirwill be used for storage.Example of configuration:
worker:tcScratch:storageClassName: "gp2"requestStorage: "100Gi"
Amazon EFS Remote Storage
If you are running Kubernetes on Amazon EKS, you can use Amazon EFS storage for the shared storage. You will need to:
- Install Amazon EFS CSI Driver on the cluster to use EFS
- Create EFS file system via Amazon EFS console or command line
- Set Throughput mode to Elastic or Provisioned for higher throughput levels
- Add mount targets for the node's subnets
- Create a storage class for Amazon EFS
Detect Components
The tables list every component the chart can deploy. The Worker, S3 Connector, ICAP Connector and Spectra Detect Manager sections below describe when each optional component is deployed.
List of Detect Worker Components
| Component | Image | Mandatory/Optional | Scaling * (see Appendix) |
|---|---|---|---|
<release_name>-wrk-auth | rl-detect-auth | Optional | N/A |
<release_name>-wrk-auth-proxy | nginx | Optional | N/A |
<release_name>-wrk-receiver | rl-detect-receiver | Mandatory | CPU |
<release_name>-wrk-preproc | rl-detect-preprocessor | Optional | QUEUE |
<release_name>-wrk-proc | rl-processor | Mandatory | QUEUE |
<release_name>-wrk-proc-retry | rl-processor | Mandatory | QUEUE |
<release_name>-wrk-preproc-unp | rl-processor | Optional | QUEUE |
<release_name>-wrk-tclibs | rl-tclibs | Mandatory | CPU |
<release_name>-wrk-postproc | rl-detect-postprocessor | Mandatory | QUEUE |
<release_name>-wrk-cloud-cache | rl-cloud-cache | Optional | N/A |
<release_name>-wrk-cleanup-job | rl-detect-utilities | Mandatory | N/A |
<release_name>-wrk-health-job | rl-detect-utilities | Mandatory | N/A |
<release_name>-wrk-config-mng | rl-detect-config-manager | Optional | N/A |
<release_name>-wrk-yara-sync | rl-detect-yara-sync | Optional | N/A |
List of Detect Integration Components
S3 Connector
| Component | Image | Mandatory/Optional | Scaling * (see Appendix) |
|---|---|---|---|
<release_name>-connector-s3 | rl-integration-s3 | Optional | N/A |
ICAP Connector
| Component | Image | Mandatory/Optional | Scaling * (see Appendix) |
|---|---|---|---|
<release_name>-connector-icap | rl-integration-icap and rl-integration-nginx | Optional | N/A |
List of Detect Manager Components
| Component | Image | Mandatory/Optional | Scaling * (see Appendix) |
|---|---|---|---|
<release_name>-sdm-portal | rl-detect-portal | Optional | CPU |
<release_name>-celery-worker | rl-detect-portal-celery | Optional | QUEUE |
<release_name>-celery-scheduler | rl-detect-portal-celery | Optional | N/A |
<release_name>-sdm-data-change | rl-detect-data-change | Optional | N/A |
<release_name>-clickhouse | clickhouse/clickhouse-server | Optional | N/A |
<release_name>-postfix | ghcr.io/devture/exim-relay | Optional | N/A |
<release_name>-seaweedfs | chrislusf/seaweedfs | Optional | N/A |
Spectra Detect Worker
Introduction
Spectra Detect Worker analyzes files submitted via the Usage API (or via connector) and produces a detailed analysis report for every file using the built-in Spectra Core static analysis engine.
Worker is composed of the following components:
| Component | Description |
|---|---|
wrk-auth | Authentication service |
wrk-auth-proxy | Authentication reverse proxy |
wrk-receiver | File receiver service |
wrk-preproc | File preprocessing service |
wrk-proc | File processing service |
wrk-proc-retry | Retry and large file processing service |
wrk-preproc-unp | Preprocessor unpacking service |
wrk-tclibs | Tclibs service |
wrk-postproc | Postprocessing service |
wrk-cloud-cache | Cloud cache service |
wrk-cleanup-job | Cleanup job for old files and tasks |
wrk-health-job | Health check job |
wrk-config-mng | Configuration management service (Worker configuration given to SDM) |
wrk-yara-sync | Yara sync service |
Component Deployment Conditions
Prerequisite for all components: worker.enabled: true must be set in the values file.
| Component | Deployment Condition | Description |
|---|---|---|
wrk-auth | worker.configuration.authentication.enabled: true and worker.configuration.authentication.externalAuthUrl: "" | Deployed only when authentication is enabled and external authentication service is not used. |
wrk-auth-proxy | worker.configuration.authentication.enabled: true and worker.ingress.className != "nginx" | Deployed only if authentication is enabled and ingress doesn't support sub-request auth (currently if not nginx ingress). |
wrk-receiver | - | Always deployed. |
wrk-preproc | worker.configuration.cloud.enabled: true and (worker.configuration.cloudAutomation.spexUpload.enabled: true or worker.configuration.cloudAutomation.dataChangeSubscribe: true) | Deployed only when Cloud and either AV file analysis or data change subscribe is enabled. |
wrk-proc | - | Always deployed. |
wrk-proc-retry | - | Always deployed. |
wrk-preproc-unp | worker.configuration.cloud.enabled: true andworker.configuration.cloudAutomation.spexUpload.enabled: true and worker.configuration.cloudAutomation.spexUpload.scanUnpackedFiles | Deployed only when Cloud is enabled, AV file analysis is enabled and scanning of unpacked files is enabled. |
wrk-tclibs | - | Always deployed. |
wrk-postproc | - | Always deployed. |
wrk-cloud-cache | worker.configuration.cloud.enabled: true andworker.configuration.cloudCache.enabled: true | Deployed only if cloud and cloud cache are enabled. |
wrk-cleanup-job | - | Always deployed. |
wrk-health-job | - | Always deployed. |
wrk-config-mng | (worker.configManager.enabled: true or worker.configuration.yara.enabled: true) and (SDM deployed with umbrella or worker.sdmPortal.urlOverride configured) | Deployed if config manager feature is enabled and if SDM is properly configured (either SDM deployed with umbrella along with the worker or SDM Portal URL override is provided). |
wrk-yara-sync | worker.configuration.yara.enabled: true | Deployed only if Yara is enabled. |
Dependencies
RabbitMQ and PostgreSQL are needed for Worker to function properly. These components can be externally provided or deployed as part of the same Detect Platform chart.
View the RabbitMQ and PostgreSQL documentation for more information.
Application Secrets
Multiple secrets are needed for proper Worker functionality. The list of all the secrets can be found in the Worker Secrets section.
All Worker secret names can be customized and they can be created with Helm Chart. More information about secret customization can be found here.
Configuration Reference
Configuration for Worker components can be found in the Configuration Reference.
Default Resource Configuration
| Component | CPU Request | CPU Limit | Memory Request | Memory Limit |
|---|---|---|---|---|
| wrk-auth | 500m | 4000m | 128Mi | 256Mi |
| wrk-auth-proxy | 250m | 2000m | 128Mi | 512Mi |
| wrk-receiver | 2000m | 5000m | 1Gi | 8Gi |
| wrk-preproc | 1000m | 4000m | 1Gi | 4Gi |
| wrk-proc | 4000m | ~ | 4Gi | 32Gi |
| wrk-proc-retry | 4000m | ~ | 8Gi | 64Gi |
| wrk-preproc-unp | 4000m | ~ | 4Gi | 16Gi |
| wrk-tclibs | 1000m | 2000m | 1Gi | 2Gi |
| wrk-postproc | 2500m | ~ | 2Gi | 16Gi |
| wrk-cloud-cache | 1000m | 4000m | 1Gi | 4Gi |
| wrk-cleanup-job | 1000m | 2000m | 1Gi | 2Gi |
| wrk-health-job | 1000m | 2000m | 1Gi | 2Gi |
| wrk-config-mng | 250m | 1000m | 128Mi | 256Mi |
| wrk-yara-sync | 1000m | 2000m | 1Gi | 2Gi |
Processor Configurations
Two types of processors are always deployed:
- Normal: Optimized for low resource usage and cost-effective deployment
- Large: Optimized for high throughput and performance
While the majority of configuration is shared between the two processors (defined in worker.configuration section), configuration overrides for Large processor are available and configurable within the worker.configuration.largeFileProcessingOverrides section. By default, these overrides are enabled and can be disabled if necessary.
Configuration sections that support override are:
cefclassifycloudcloudCachegeneralhashesprocessingpropagationstringsticorewordlist
More information for the above mentioned sections and their possible configuration values can be found in the Worker Application Configuration.
Default values
The following table lists the default values for both processors and highlights the differences between them:
| Parameter | Normal Processor | Large Processor |
|---|---|---|
cloudCache.enabled | true | true |
cloudCache.ttl | 240 | 480 |
general.tsWorkerCheckThresholdMins | 720 | 4320 |
processing.cacheEnabled | false | true |
processing.cacheTimeToLive | 0 | 0 |
processing.timeout | 28800 | 259200 |
ticore.processingMode | "best" | "fast" |
Authentication
Authentication is achieved by leveraging Authentication based on SubRequest Result.
This is natively supported by the Nginx Ingress Controller. In case a different ingress controller is used (e.g. ALB on AWS), additional Nginx Reverse Proxy is deployed in order to support the authentication mechanism.
Authentication can be configured in the following ways:
-
Using external authentication service by specifying the
externalAuthUrlin the configurationIf an external authentication service is enabled, all header values from the incoming request will be forwarded to the external authentication service.
The external authentication service needs to return following responses in order to support this authentication mechanism:
HTTP 200: authentication successful (ingress will forward the traffic to the backend service)HTTP 401orHTTP 403: authentication failed
-
Using a simple authentication service deployed in the cluster
Authentication service supports a simple Token check based on API path.
The token needs to be included in the "Authorization" header with the "Token" prefix/scheme.
curl -H "Authorization: Token <defined token>" <other options> <URL>The tokens are configured as secrets with the following behavior:
| Secret (when custom secret name is used) | Secret (default secret name) | Type | Description | Used in deployments (Pods) |
|---|---|---|---|---|
<secrets.api.customSecretName> | <release_name>-secret-worker-api-token | Optional | Token secret which contains token that is used to protect all endpoints with /api/ prefix, e.g. file upload. | Auth |
<secrets.apiTask.customSecretName> | <release_name>-secret-worker-api-task-token | Optional | Token secret which contains token that is used to protect /api/tiscale/v1/task endpoints. If left empty, the mentioned API is protected by <release_name>-secret-worker-api-token | Auth |
The authentication service won’t be deployed in the cluster if externalAuthUrl is defined:
# Example for enabling authentication
worker:
  configuration:
    authentication:
      enabled: true
      externalAuthUrl: ""
Upload file for processing
There are multiple ways to upload a file for analysis:
- direct upload
- upload from URL
- upload of container image
More information about the upload endpoints can be found in the API Reference.
Synchronous direct file upload
Uploads a file for processing and waits until processing is complete, returning the full analysis report directly in the response.
To modify synchronous API timeouts or connection limits, apply the appropriate annotations to the Ingress resource.
Container Image Upload from Private Repository
On container image upload, the image is directly pulled from the specified registry.
To pull images from a private repository, the following conditions should be met:
-
Authentication: Valid credentials must be provided (e.g., a dockerconfigjson secret) for identity verification.
-
Trust/Encryption: If the registry uses a private Certificate Authority (CA), the relevant root certificates must be installed on the host or injected into the container runtime to establish a trusted connection.
Authentication credentials
Authentication credentials can be provided via dockerconfigjson secret, which supports credentials for multiple repositories.
Like all other secrets, this secret can also have customized name and can be created from the Helm Chart. More information can be found in Secrets.
If the secret is created with Helm Chart, the list with credentials needs to be provided in which each list item contains username, password and registry name.
There is a limitation on Helm Chart secret creation. For each registry, the credentials have to be provided because identity token is not yet supported.
If the secret is not created with Helm Chart, it needs to be created manually or already exist in the cluster (e.g. secret management tools like AWS Secrets Manager, HashiCorp Vault, etc.).
Steps for manual creation:
- Create config.json file with the following structure:
{
  "auths": {
    "https://some.repo.io/": {
      "auth": "BASE64_ENCODED_USER_PASS"
    },
    "https://another.repo.io/": {
      "identitytoken": "abcdef..."
    },
    "https://some-other.repo.io/": {
      "auth": "BASE64_ENCODED_USER_PASS"
    },
    ...
  }
}
BASE64_ENCODED_USER_PASS = echo -n "username:password" | base64
- Create secret from the file:
kubectl create secret generic some-secret-name --from-file=.dockerconfigjson=config.json --type=kubernetes.io/dockerconfigjson
Since reloader is not yet supported for Worker, manual restart of the receiver deployment is needed on secret change:
kubectl rollout restart deployment/<receiver-deployment-name>
Certificates
Certificates can be provided via Opaque secret. This secret has only one key ca_bundle which contains all the necessary certificates. Like all other secrets, this secret can also have customized name and can be created from the Helm Chart. More information can be found in Secrets.
If the secret is created with Helm Chart, the list with certificates needs to be provided.
To load the content of the file directly to the variable on upgrade/install, --set-file needs to be used:
helm upgrade -i <release_name> <path_to_chart>/detect-platform --set-file worker.secrets.caCerts.certificates[0]=/path/to/certificate/certificate1.pem --set-file worker.secrets.caCerts.certificates[1]=/path/to/certificate/certificate2.pem
On manual secret creation, the certificates need to be manually combined into one and secret needs to be created from the resulting file:
cat certificate.pem certificate2.pem certificate3.pem > bundle.pem

kubectl create secret generic cert-secret-name --from-file=ca_bundle=./path/to/file/bundle.pem
Since reloader is not yet supported for Worker, manual restart of the receiver deployment is needed on secret change:
kubectl rollout restart deployment/<receiver-deployment-name>
S3 Connector
Introduction
S3 Connector allows automatical retrieval of a large number of files from external S3 buckets.
S3 Connector is composed of the following components:
| Component | Description |
|---|---|
connector-s3 | S3 Connector service |
Component Deployment Conditions
For connectorS3 to work properly, connectorS3.enabled: true must be set in the values file and at least one input needs to be configured connectorS3.configuration.inputs.
Application Secrets
Connectors can use either a pre-provided identity (such as Pod Identity) or configured credentials.
If choosing the latter, set the credentials on each S3 connection, in global.s3Connections.<connection_name>.secrets.credentials, either as an existing secret with customSecretName or as a secret the chart creates. For more information, see S3 Connector Secrets and Secrets.
Configuration Reference
Configuration for Connector S3 can be found in the S3 Connector Configuration Reference.
Default Resource Configuration
| Component | CPU Request | CPU Limit | Memory Request | Memory Limit |
|---|---|---|---|---|
| connector-s3 | 4000m | ~ | 2Gi | 6Gi |
ICAP Connector
Introduction
The ICAP Connector acts as an ICAP server and processes files sent through ICAP-enabled systems. It applies rules based on classifications, file size, and processing time, ensuring files meet the specified criteria before being analyzed by Spectra Detect.
The service is exposed externally via a Layer 4 NLB to manage all incoming ingress traffic.
ICAP Connector is composed of the following components:
| Component | Description |
|---|---|
connector-icap | ICAP Server |
Component Deployment Conditions
For the ICAP connector to work properly, connectorIcap.enabled: true must be set in the values file.
Application Secrets
ICAP Connector uses a certificate for TLS communication. To support that, secret of type kubernetes.io/tls needs to be provided.
Like in other components, secret name can be customized and the secret can be created with Helm Chart. More information about secret customization can be found here.
Configuration Reference
Configuration for ICAP Connector can be found in the ICAP Connector Configuration Reference.
Default Resource Configuration
ICAP Connector has only one component (deployment connector-icap), which has two containers: the main service with ICAP Server and the NGINX Sidecar.
| Component | CPU Request | CPU Limit | Memory Request | Memory Limit |
|---|---|---|---|---|
| connector-icap (icap-server) | 500m | ~ | 2Gi | 4Gi |
| connector-icap (nginx-sidecar) | 100m | ~ | 128Mi | 256Mi |
Spectra Detect Manager (SDM)
Introduction
Spectra Detect Manager (SDM) is a web-based management portal for Spectra Detect deployments. It provides centralized configuration, monitoring, and administration capabilities.
The SDM deployment is packaged as an umbrella Helm chart (detect-sdm) that orchestrates the following components:
| Component | Description |
|---|---|
sdm-portal | Main web portal application |
sdm-celery-worker | Background task processor using Celery |
sdm-data-change | Data change notification service (conditional) |
seaweedfs | S3-compatible object storage (conditional) |
clickhouse | Analytics database for central logging (conditional) |
postfix | SMTP relay for email notifications |
Component Deployment Conditions
Not all SDM components are deployed by default. The umbrella chart uses the following conditions to determine which subcharts are installed:
| Component | Deployment Condition | Description |
|---|---|---|
sdm-portal | sdmPortal.enabled: true | Core portal, always deployed when SDM is enabled |
sdm-celery-worker | sdmPortal.enabled: true | Background task processor, always deployed when SDM is enabled |
postfix | sdmPortal.enabled: true | SMTP relay, always deployed when SDM is enabled |
seaweedfs | sdmPortal.config.centralFileStorage.enabled: true | Object storage, deployed only when central file storage is enabled |
clickhouse | sdmPortal.config.centralLogging.enabled: true | Analytics database, deployed only when central logging is enabled |
sdm-data-change | sdmPortal.config.centralLogging.enabled: true | Data change service, deployed only when central logging is enabled |
Dependencies
RabbitMQ and PostgreSQL
RabbitMQ and PostgreSQL are required for SDM to function properly. PostgreSQL database is used for storing configuration and application data, and RabbitMQ is used for task queue management with Celery workers.
These components can be externally provided or deployed as part of the same Detect Platform chart.
View the RabbitMQ and PostgreSQL documentation for more information.
ClickHouse (Conditional)
ClickHouse is deployed and used for central logging and analytics when sdmPortal.config.centralLogging.enabled is set to true. Enabling central logging also deploys the Data Change Service (DCS).
sdmPortal:
  config:
    centralLogging:
      enabled: true
View the Clickhouse Configuration Reference for more information about the configuration options and the secrets configuration.
Data Change Service Secrets (Conditional)
The Data Change Service (sdm-data-change) is deployed when central logging is enabled (sdmPortal.config.centralLogging.enabled: true).
Uses the following credentials:
- PostgreSQL
- ClickHouse (optional)
- Postfix (optional)
- Spectra Intelligence (optional)
View the Data Change Service Configuration Reference for more information about the configuration options.
SeaweedFS (Conditional)
SeaweedFS provides S3-compatible object storage for file management. It is deployed when central file storage is enabled (sdmPortal.config.centralFileStorage.enabled: true). Credentials are auto-generated (<release_name>-seaweedfs-secret).
Enabling central file storage requires central logging to also be enabled.
View the SeaweedFS Configuration Reference for more information about the configuration options.
Postfix
Postfix provides SMTP relay capabilities for sending email notifications.
View the Postfix Configuration Reference for more information about the configuration options and the secrets configuration.
Loki and Prometheus (Optional)
The SDM Portal optionally integrates with Loki for log aggregation and Prometheus for metrics. When the logging stack is deployed, the portal gets the connection details those components.
The Prometheus Configuration chart needs to be enabled to allow the SDM Portal to access the connection details. More information can be found here.
Application Secrets
Multiple SDM components create use secrets for application configuration and authentication.
Some secrets are automatically generated by the charts and cannot be customized, but for most of the secrets used in SDM, the same applies as for other secrets: their names can be customized and they can be created from the Helm Chart. More information about secret customization can be found here.
General information about the secrets that are customizable and used in SDM can be found here:
Since SDM is composed as an umbrella chart and contains multiple components, the custom secret names are defined on a global level. Configuration Reference for that can be found here.
Detect Configuration Mode
Detect SDM can be configured in two different ways:
- read mode - current configuration is visible on the SDM Portal
- write mode - configuration can be modified via the SDM Portal
For write mode, the following needs to be set in the values.yaml:
- choose the correct mode:
global.appliance.configMode: "STANDARD" - enable config manager:
worker.configManager.enabled: true - enable SDM:
global.sdmEnabled: true - registry secret must exist (further described in step 3 of Deploying Detect using Helm Charts section)
In write mode, the SDM Portal is the only source of configuration. Workers don't send their own configuration to the SDM Portal when they register; the configuration you apply in the SDM Portal is what they use. Applying configuration again doesn't change stored secrets, such as the Spectra Intelligence password, unless you change them.
Custom secret names are not supported in the UI configuration mode. Only the default secret names can be used.
Configuration Reference
Configuration for all SDM components can be found in the SDM Configuration Reference.
Default Resource Configuration
| Component | CPU Request | CPU Limit | Memory Request | Memory Limit |
|---|---|---|---|---|
| sdm-portal | 2000m | 3000m | 2Gi | 4Gi |
| sdm-celery-worker | 1000m | 3000m | 2Gi | 4Gi |
| seaweedfs | 1000m | 3000m | 2Gi | 4Gi |
| clickhouse | 8 | 16 | 16Gi | 32Gi |
| postfix | 500m | 1000m | 512Mi | 1Gi |
| sdm-data-change | 500m | 2000m | 512Mi | 2Gi |
Appendix
Set Report Types
- Report types can be added with the
--set-fileoption by providing the name of the report type (added as a new key toreportTypes) and path to the file in which the filter is defined in JSON format - Report type name must match the one defined in the given file
- Report types can be deleted by defining the name of the
report.typeand setting it to the value "" instead of adding the filepath - Limitation: max size of the report type file is 3MiB
- In
STANDARDmode, report types defined in SDM also reach the Workers. SDM doesn't delete report types that you add with--set-file, and when both define a report type with the same name, SDM's definition is used.
Set Report Types Example
# Example of adding the 2 report types
helm upgrade -i "${RELEASE_NAME}" oci://registry.reversinglabs.com/detect/charts/detect-suite/detect-platform -f custom_values.yaml \
--set-file worker.reportTypes.some_report_type=<path-to-report-type>/some_report-type.json
--set-file worker.reportTypes.extendedNoTags=<path-to-report-type>/extendedNoTags.json


# Example of adding the new report type and removing the existing report type
helm upgrade -i "${RELEASE_NAME}" oci://registry.reversinglabs.com/detect/charts/detect-suite/detect-platform -f custom_values.yaml \
--set-file worker.reportTypes.some_report_type=<path-to-report-type>/some_report-type.json \
--set-file worker.reportTypes.extendedNoTags="" \


############### Example of the report type file content ###############
{
  "name": "exampleReportType",
  "fields": {
    "info" : {
      "statistics" : true,
      "unpacking" : true,
      "package" : true,
      "file" : true,
      "identification" : true
},
    "story": true,
    "tags" : true,
    "indicators" : true,
    "classification" : true,
    "relationships" : true,
    "metadata" : true
  }
}
Use Report Type Example
Uploading a report type using the method above only makes the report type available to the system. To actually use the custom report type, you must configure it on the appropriate egress integration. For example, to use a custom report type with S3 storage:
# Specify the report type that should be applied to the Worker analysis report before storing it. Report types are results of filtering the full report.
worker:
  configuration:
    reportS3:
      reportType: "custom_report_type"
Set YARA Rules
- YARA rules can be added with the
--set-fileoption by providing the name of the rule file (added as a new key toyaraRules) and path to the file in which the rule is defined - The rule file name must follow camelCase format
- YARA rules can be deleted by defining the rule file name and setting it to the value "" instead of adding the filepath
- Limitation: max size of YARA ruleset file is 40 MB.
Set YARA Rules Example
# Example of adding yara rules
helm upgrade -i "${RELEASE_NAME}" oci://registry.reversinglabs.com/detect/charts/detect-platform -f custom_values.yaml \
--set-file worker.yaraRules.rule1=<path-to-yara-rule>/someYaraRule.yara \
--set-file worker.yaraRules.rule2=<path-to-yara-rule>/other_yara_rule.yara


# Example of adding the new yara rule and removing the existing yara rule
helm upgrade -i "${RELEASE_NAME}" oci://registry.reversinglabs.com/detect/charts/detect-suite/detect-platform -f custom_values.yaml \
--set-file worker.yaraRules.rule1=<path-to-yara-rule>/someYaraRule.yara \
--set-file worker.yaraRules.rule2=""


############### Example of the yara rule file content ###############
rule ExampleRule : tc_detection malicious
{
    meta:
        tc_detection_type = "Adware"
        tc_detection_name = "EXAMPLEYARA"
        tc_detection_factor = 5
    strings:
        $1 = "example"
        $2 = "eeeeeee"
    condition:
        $1 or $2
}
Set Advanced Filter
- Advanced filters can be added with the
--set-fileoption by providing the name of the filter (added as a new key toadvancedFilters) and path to the file in which the filter is defined in YAML format. Filter name must match the one defined in the given file - Advanced filters can be deleted by defining the name of the filter and setting it to the value "" instead of adding the filepath
# Example of adding Advance Filter
helm upgrade -i "${RELEASE_NAME}" oci://registry.reversinglabs.com/detect/charts/detect-suite/detect-platform -f custom_values.yaml \
--set-file worker.advancedFilters.filter1=/some_filter.yaml \
--set-file worker.advancedFilters.filter2=/other_filter.yaml

# Example of adding Advance Filter
helm upgrade -i "${RELEASE_NAME}" oci://registry.reversinglabs.com/detect/charts/detect-suite/detect-platform -f custom_values.yaml \
--set-file worker.advancedFilters.filter1=/some_filter.yaml \
--set-file worker.advancedFilters.filter2=""
Example of the filter file content:
name: some_filter
description: Custom filter for Spectra Analyze integration
scope: container
type: filter_in
condition:
 and:
  - range:
     info.file.size:
      gt: 50
      lt: 20000
  - one_of:
     classification.classification:
      - 3
      - 2
Configuration Reference
View the Configuration Reference for more information about the configuration options.
Central Logging
Central Logging is used to collect and display information about all the events happening on connected Workers and integrations (S3, ICAP). With this feature enabled, SDM home page shows information about processed files: classification, size and scan date, to name a few.
Set global.centralLoggingEnabled to true to enable central logging across all components in a single step. Central logging requires Spectra Detect Manager: when global.sdmEnabled is false, all sub-charts disable central logging even if global.centralLoggingEnabled is true. Individual component settings (for example, worker.configuration.centralManager.queueLoggingEnabled or connectorS3.configuration.systemInfo.queueLoggingEnabled) can still be overridden if needed.
Events are stored in ClickHouse, the analytics database behind Central Logging.
ClickHouse is also used by AV file analysis. When the cloud reports that an AV analysis is complete, that notification is written to ClickHouse, and the event is what tells Spectra Detect it can continue processing the file.
ClickHouse isn't mission-critical. If AV file analysis isn't used and analytics is turned off, ClickHouse isn't deployed at all.
Logging
Logging is an optional sub-chart within the Detect Platform deployment. When enabled, it provides a complete data pipeline for managing logs across the environment. Contains the following components:
- Alloy
- Loki
- Grafana
Alloy
Discovers and collects logs on the cluster. It can be configured to collect only logs from specific namespaces.
View the Alloy Configuration Reference for more information about the configuration options.
Grafana
Provides a centralized dashboard for searching and visualizing logs in a streamlined, user-friendly interface. Global access is managed via Ingress resource, providing a secure and unified entry point for data exploration.
There is a dashboard named "Kubernetes Logs" which shows logs from all the components of the Detect application in a specific namespace, apart from logging components and Prometheus. Default namespace is the one where Grafana is deployed. The dropdown menu allows for easy switching between individual namespaces or a global 'All Namespaces' view.
View the Grafana Configuration Reference for more information about the configuration options.
Loki
Acts as the central repository for log storage, processing incoming data from Alloy and serving it to Grafana for seamless searching and analysis.
View the Loki Configuration Reference for more information about the configuration options.
Scaling
Scaling of the services is done in one of the following ways:
- Scaling based on CPU usage
- Scaling based on the number of messages waiting in the queue
Scaling based on CPU usage
Scaling based on CPU usage is implemented in the following way:
- Users can provide
triggerCPUValuewhich represents the percentage of the given CPU resources. Service will be scaled up when this threshold is reached and scaled down when CPU usage drops below the threshold. - CPU resources are defined with
resources.limits.cpuvalue, which represents the maximum CPU value that can be given to the pod - Default values:
- scaling enabled by default (except for SDM)
- when CPU usage reaches 75%, the scaling is triggered
- scaling delay is 30 seconds (scaling is triggered when scaling condition is met for 30 seconds)
- one pod in every 30 seconds is created
- number of maximum replicas is 8
- every 10 seconds the average CPU status is checked
- Worker services with CPU scaling:
- receiver
- tclibs
- SDM services with CPU scaling:
- sdm-portal
Scaling based on the number of messages waiting in the queue
Scaling based on the number of messages waiting in the queue is implemented in the following way:
- Scaling enabled by default (except for SDM)
- User can provide
targetInputQueueSizewhich represents the number of messages in the queue for which the scaling will start - different behavior for Worker and SDM components:
- Worker services are scaled to 0 when the relevant queues are empty
- Each worker service has defined at least two triggers: activation (0 -> 1, 1 -> 0) and scaling (1 -> N, N -> 1)
- Unacknowledged messages are excluded from the calculation in scaling trigger, included for the calculation in activation trigger
- Each scaled service has a different queue that is observed and scaled on
- Default values:
- when 10 or more messages are waiting in the queue for a longer period of time the scaling will be triggered
- scaling delay is 15 seconds (scaling is triggered when scaling condition is met for 15 seconds)
- one pod in every 30 seconds is created
- number of minimum replicas is 0
- number of maximum replicas is 8
- every 10 seconds status of the queue is checked
- Worker services with Queue based scaling:
- processor: number of messages in the
tiscale.hagent_inputis used for scaling - processor-retry: number of messages in the
tiscale.hagent_retryis used for scaling - postprocessor: number of messages in the
tiscale.hagent_result/tiscale.hagent_erroris used for scaling - preprocessor: number of messages in the
tiscale.preprocessingis used for scaling (tiscale.preprocessing_dispatcherused only for activation) - preprocessor-unpacker: number of messages in the
tiscale.preprocessing_unpackeris used for scaling
- processor: number of messages in the
- SDM services with Queue based scaling:
- celery-worker: number of messages in the
tasks.defaultis used for scaling
- celery-worker: number of messages in the
Scaling configuration
| Value | Description |
|---|---|
enabled | enables/disables auto-scaling |
maxReplicas | maximum number of replicas that can be deployed when scaling in enabled |
minReplicas | minimum number of replicas that need to be deployed |
pollingInterval | interval to check each trigger (in seconds) |
cooldownPeriod | the period to wait after the last trigger reported active before scaling the resource back to 0, in seconds |
scaleUp | configuration values for scaling up |
scaleUp.stabilizationWindow | number of continuous seconds in which the scaling condition is met (when reached, scale up is started) |
scaleUp.numberOfPods | number of pods that can be scaled in the defined period |
scaleUp.period | interval in which the numberOfPods value is applied |
scaleDown | configuration values for scaling down |
scaleDown.stabilizationWindow | number of continuous seconds in which the scaling condition is not met (when reached, scale down is started) |
| CPU scaling | |
triggerCPUValue | CPU value (in percentage), which will cause scaling when reached; percentage is taken from the resource.limits.cpu value; limits have to be set up |
| Queue scaling | |
targetInputQueueSize | Number of waiting messages to trigger scaling on; unacknowledged messages are excluded |
Secrets
For all secrets used in the deployment, the following is applied:
-
Default secret names can be overridden with custom values to allow for easier integration with third-party secret managers.
-
All secrets must either be managed within the Helm Chart, created manually, or integrated via external secret management tools (e.g. AWS Secrets Manager, HashiCorp Vault, etc.).
Use creation of secrets with Helm Charts for convenience/testing only. Do not store sensitive credentials in configuration files that are committed to Git. Consider using a dedicated secret management solution (e.g., Sealed Secrets, External Secrets, or Vault) for production environments.
View the Configuration Reference for more information about the creating secrets with Helm Charts:
- Worker Secret Configuration Values
- S3 Connector Input Configuration Values
- ICAP Connector Component Configuration Values
- SDM Portal Secret Configuration Values
- ClickHouse Secret Configuration Values
- Postfix Secret Configuration Values
- SDM Custom Secret Names
- RabbitMQ Configuration Values
- PostgreSQL Configuration Values