Dashboard
This short introductory section is intended to help with understanding the basic layout of the user interface, terminology and visual indicators that are used on the Manager and in the rest of this User Guide.
Global Header Bar
At the top of the Manager interface is the global header bar, containing the most commonly used options and the main appliance menu used to access all sections of the Manager.
Quota: Usage-based quota insights for all Spectra Intelligence accounts used by the connected appliances. Clicking the triangle icon expands the header and displays the limit and the license renewal dates for each account. Quota limit statuses are color indicated. Additionally, this menu contains the option to contact ReversingLabs Support.
Dashboard: The dashboard displays statistics related to the amount and type of files that have been submitted and processed on the appliance within a specified time range.
Central Configuration : The Manager Central Configuration Manager allows users to modify configuration settings on Spectra Analyze and Spectra Detect appliances directly from the Manager interface. The Central Configuration feature makes it easier to configure appliances remotely, and to ensure that the settings are consistent and correct across multiple appliances. The appliances must first be connected and authorized on the Manager instance.
Administration: allows users to access and configure Spectra Detect Manager Settings, Yara Synchronization, User Management, Token Management, Redundancy, Backup and Restore, Update Bin Management, and Licensing.
Help: Contains an option to access Manager API Documentation.
User menu: Shows the username of the current user, contains link to user details (My Details), and the option to Log Out from the appliance.
Integrations Status Indicators: Contains arrow labels providing information on which file input sources and file/report output sources are currently configured on the connected Hub groups.
Integrations Indicators
The Integrations Indicators at the top right of the interface contain File Ingress Connectors and File Egress Connectors providing information on which file input sources (Connectors) and file/report output sources (Egress Integrations) are currently configured on the connected Hub groups. Green icons indicate that the item has an existing configuration, not necessarily that the configuration is correct, and the service is connected, whereas grey icons indicate that the item does not have an existing configuration. Hub groups with configured Connectors are listed below the Connector, and outside of parentheses.
Central Logging
The Manager dashboard has two modes: central logging enabled/disabled. If central logging is enabled (), users can access the Analytics tab which shows various statistics for the processed files before showing appliance status. If it’s not enabled, the default tab is Appliance Management showing the status of the Manager and all connected appliances.
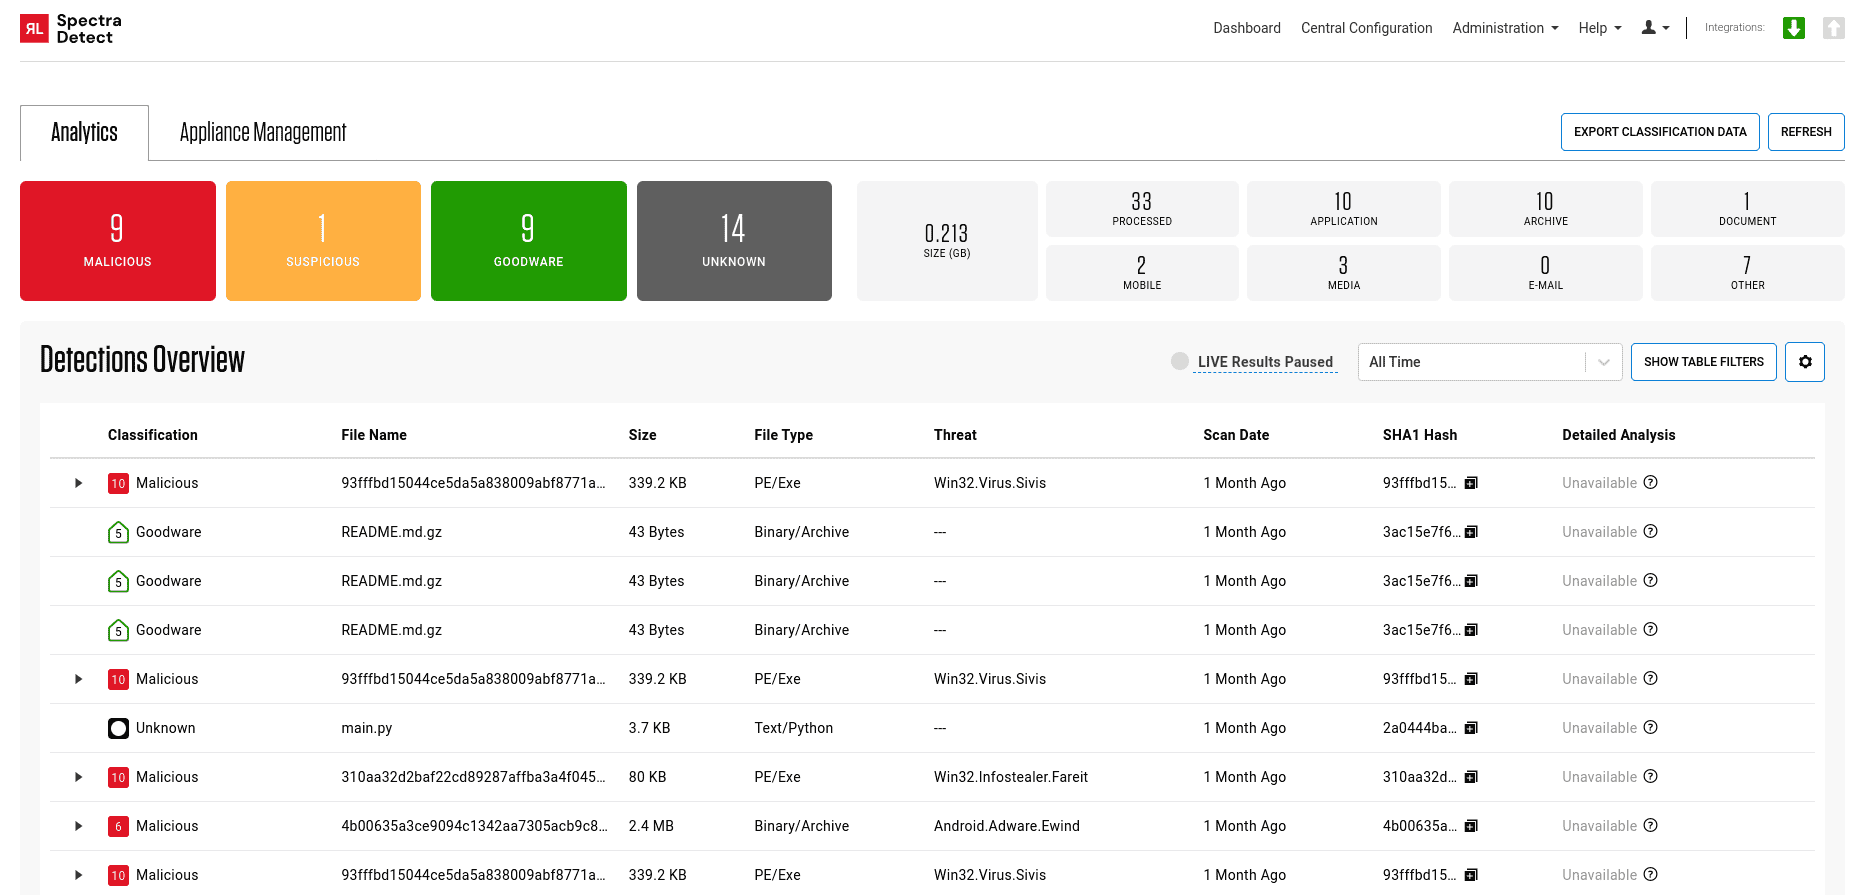
When central logging is enabled, the Analytics tab on the dashboard shows a detailed breakdown of analyzed files according to classification state, file type, malware family, the total size of all processed files, and more.
This classification data and error logs can be exported to CSV by clicking the Export Classification Data button at the top of the page.
Note that some processed files in these .csv files appear with slightly changed names, e.g. - become [-]. This is a measure to ensure sanitized input.
Exported classification data CSV files contain the following information: sample (container), classification, rca_factor, malware_platform, malware_type, malware_family, filename, file_size (bytes), file_type_group, file_type, file_subtype, identification, processed_at, hostname.
Detections Overview
The Detections Overview table is a list of files analyzed on connected Workers. It updates in 15 second intervals, and shows sample classification, file name, size, file type, threat name, scan date, AV detections, SHA1 hash and detailed analysis.
The table can be sorted by clicking the column headers, and filtered using the Show Table Filters button which reveals text field filters above the table columns. All text field filters are optional, except for “File name”. Results can additionally be filtered by the time they were analyzed using the drop-down menu at the top of the table.
Clicking the Showing LIVE Results button stops the table from automatically updating, which can be useful while inspecting a specific set of results. Automatic updating is also paused when the user navigates from the first page of results.
The AV Detections column in the Detections Overview table displays results from the Deep Cloud Analysis (Multi-Scanning) Service, combining Worker Static Analysis and Spectra Intelligence analysis. It can be expanded to show the names of AV scanners and any detected threats, reflecting the analysis conducted by the Spectra Intelligence, where files are sent to AV scanners in the Cloud, with the results then exposed on the Manager dashboard.
To enable the Deep Cloud Analysis (Multi-Scanning) Service, navigate to , and select the Enable Multi-Scanning checkbox. When the Multi-Scanning is enabled, Workers upload samples to the Cloud only if the sample does not already exist in the Cloud, and passes the filtering criteria: up to 2GB in size. If the sample already exists in the Cloud, the Manager will monitor for any changes in the data and update the Manager dashboard accordingly. Read more details in the Multi-Scanning section of the Spectra Detect Manager Settings chapter.
The RESCAN button sends a request to the Cloud to check for any updates associated with the submitted samples, and updates the information accordingly.
The See All Scans button opens a new page with all available Spectra Intelligence and AV Detections information.
Product integration with Spectra Analyze
The Detailed Analysis column in the Detections Overview table allows the users to import the sample analyzed on the Spectra Detect platform into Spectra Analyze for a deeper insight into the analyzed file.
For this integration to be enabled, the Manager must be connected to at least one instance of Spectra Analyze 8.1 or higher, and central logging () must be enabled. In addition, the sample must be stored either in an S3 bucket or on the Manager itself (Central Storage). If both of these features are enabled, Manager central storage takes priority (Spectra Analyze will download files from the Manager).
Processing Timeline
The Processing Timeline section of the dashboard shows a graph of uploaded, processed and post-processed samples, and also the number of samples that failed to analyze.
To retrieve a list of files that failed to analyze on the connected Spectra Detect appliances in the last 90 days, use the Export Errors / Hashes button.
The exported CSV file contains the following information:
host_uuidhostnametimeevent_typetask_idsamplecontainer
The host_uuid value is set automatically when the Worker connects to the Manager, and obtainable using the conf_centralmanager command on the Worker.
Note that exported error logs might contain double entries for some errors. For example, if a file processing task fails, causing a failed report upload to S3, this is counted as two errors, despite being one event.
Malware Types / Malware Family Count
The Malware Types and Malware Family Count charts show the analyzed samples categorized by Malware Type and Malware Family Count, respectively. Malware Type is presented as a percentage in a pie chart while Malware Families are displayed as a bar chart indicating the sample count per family.
Appliance Management
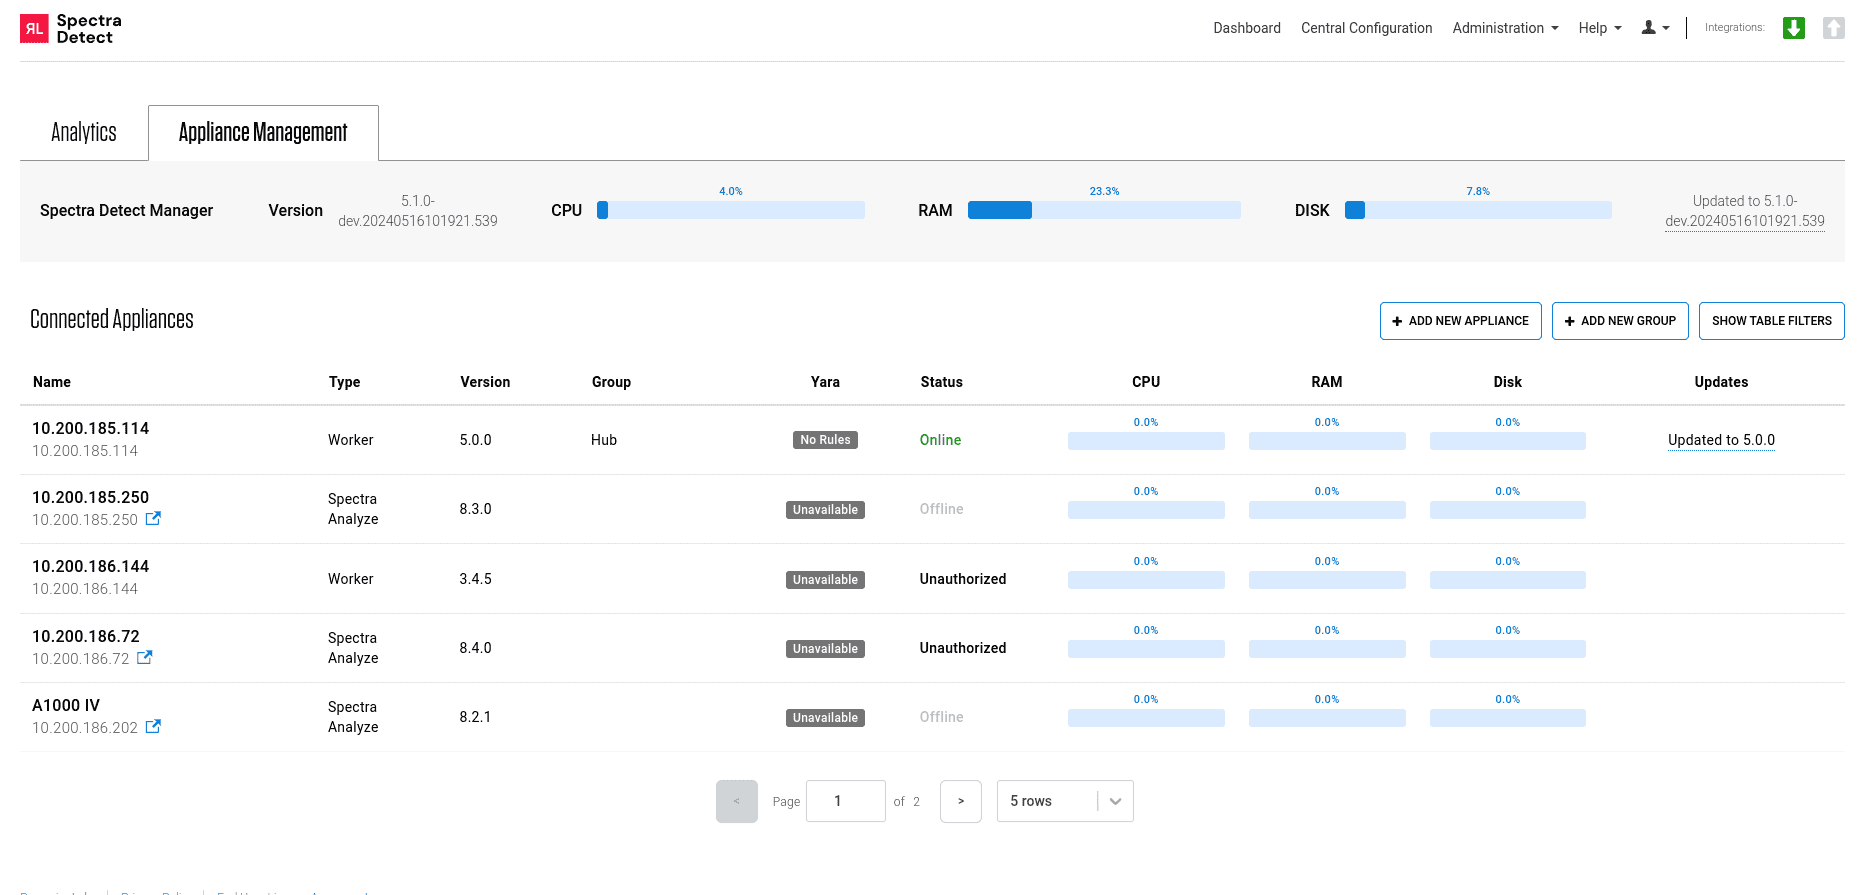
System information about the Manager instance and connected appliances can be found on the Appliance Management tab and is updated every 5 minutes. The Status column indicates whether the appliance is online, offline, unlicensed, in error state, or unauthorized. If YARA ruleset synchronization is enabled () and on at least one connected appliance that supports it, a YARA column will show the current YARA ruleset synchronization status for each appliance. Possible YARA synchronization statuses are In Sync, Not In Sync, Unknown, Please Update and Please Set To HTTPS. See the YARA Sync Page section for more details.
The Appliance Management page can be configured to display up to 100 appliances per page, and also filtered using the Show Table Filters button at the top of the list. This displays filter input fields in a row above the appliances table. Each table column has its own filter input field, allowing simultaneous filtering by multiple criteria.
Keep in mind that some actions (like configuration changes) will result in a system restart. Depending on the type of appliance, the process of restarting and reloading the configuration might take some time. Spectra Detect Worker appliances generally take longer to restart.
The following table describes common management actions and their consequences. More information can be found in the Managing Configuration Groups section.
ACTION |
APPLIANCE RESTART |
MANAGER RESTART |
|---|---|---|
Update the Manager instance |
NO |
YES |
Modify settings on the Manager instance |
NO |
YES |
Connect an appliance to the Manager |
NO |
NO |
Authorize an appliance |
NO |
NO |
Update a connected appliance |
YES |
NO |
Modify settings on the Appliance Status page |
YES |
NO |
Disconnect an appliance from the Manager |
NO |
NO |
Connecting Appliances to the Manager
Important!
Adding the same appliance to multiple Managers is not supported. It can lead to misconfigurations and conflicts. Always remove the appliance from one Manager before adding it to another.
To add an appliance, click Add new appliance on the Appliance Management tab on the Dashboard. In the Add new appliance dialog, choose the appliance type, then enter a name and an URL for the new appliance.
All appliance URLs must use the HTTPS protocol. Note that the Manager does not validate SSL certificates automatically, so users must ensure their certificates are valid prior to connecting appliances.
The SNMP community field is required for the appliance to properly communicate with the Manager, and for the Manager to display accurate status information on the dashboard page. Note that the SNMP community string set here must match the string previously configured on the appliance itself.
If the selected appliance type is TiScale Hub, an additional field called Load Balancer password becomes available in the dialog. If the password is provided here, the appliance status page will display a tab with Load Balancer (HAProxy) statistics. Note that the password must be previously configured directly on the Hub, and on all Workers connected to that Hub.
Clicking Add for Spectra Analyze appliances will redirect to the appliance login page, where the appliance must be authorized in order to successfully connect to the Manager.
If authorization does not complete successfully, the appliances will be added to the Manager and displayed on the dashboard with Unauthorized status. They can be authorized at any moment from the Appliance Status Page.
Workers and Hubs are immediately added to the Manager after clicking Add, without the authorization step.
Appliance Status Page
Apart from allowing access to Update, Edit, Authorize, and Remove options, the appliance status page provides detailed information about the system resources and health of the appliance.
If there is a problem with retrieving the status information from the appliance, a warning message is displayed at the top of the appliance status page. In this case, users should check whether the SNMP community string is properly configured for the appliance on the Manager, and on the appliance itself.
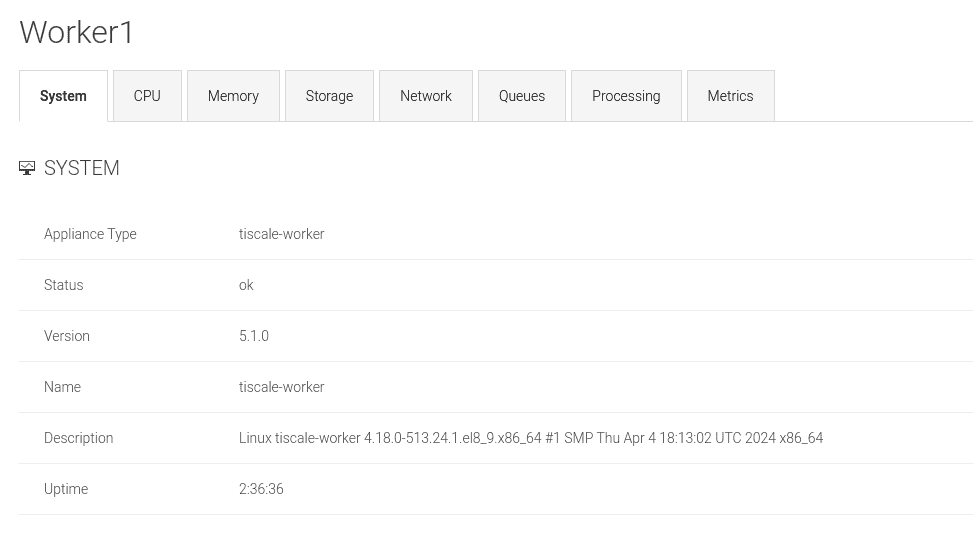
The information on the appliance status page is divided into tabs and refreshed every 5 minutes.
The appliance type - Spectra Analyze, Spectra Detect Worker, Spectra Detect Hub - determines which tabs will be visible.
TAB |
SUPPORTED ON |
DESCRIPTION |
|---|---|---|
System |
All appliance types |
Displays the appliance type, status, version, name, description, and uptime. |
CPU |
All appliance types |
Displays the number of cores on the appliance, the average load over the last minute for each individual core and for all cores. |
Storage |
All appliance types |
Shows the total storage size (in GB), the amount of used storage (in GB and percentage) and allocation units for each partition on the appliance. |
Network |
All appliance types |
Provides an overview of network devices on the appliance, with information about their type, operational and administrative status (up/down), physical address, bandwidth (in Mb/s or Gb/s), and the total amount of traffic received and sent. |
Queues |
All appliance types except Spectra Detect Hub |
If supported by the appliance type, displays the state of queues on the appliance. Queues are used to communicate between various background services. The state of all queues should be “running”, and each queue should have at least one consumer (a service connected to the queue). |
Processing |
Worker only |
If supported by the appliance type, provides statistics on the amount and size of files submitted, processed, and unpacked on the selected Worker in each of the predefined time intervals. The Queue AVG column indicates the average number of files in the incoming queue for each of the predefined time intervals. |
Load Balancer |
Hub only |
If supported by the appliance type, provides real-time information on the status of the HAProxy service used for load balancing on the Hub. The data is updated every 10 seconds. Hovering over column names in the tables provides tooltips that clarify what each column refers to. This tab is visible only if the load balancer (HAProxy) password is provided in the appliance configuration dialog. |
Metrics |
Worker only |
If supported by the appliance type, displays additional file processing and post-processing statistics. The statistics track the following events: files successfully uploaded to Worker and sent for analysis; success and failure events for file processing on the Worker; success and failure events for uploading parent files to S3; success and failure events for uploading analysis reports to Splunk and Callback server (if those report uploading options are configured on Worker). The statistics are collected for the same predefined time intervals as in the Processing tab, and preserved for the maximum duration of 1 day (24 hours). The statistics are collected using HTTP calls to the Worker service API, but the SNMP community string must be set for this tab to be visible. Counts in each interval automatically adjust to indicate only the events that occurred within the exact interval, while all events exceeding it are removed from the count. Note that the count precision may be impacted if the system is under a heavier load, but it should improve within 2-3 minutes. Additionally, extracted files are not individually counted in S3 upload events - only their parent files are. This may cause discrepancies between the count of files processed on Worker versus files uploaded to S3. |
Additional Options
The “Upload SSL Certificate” button allows the users to apply new HTTPS certificates to Workers, Hub, or Manager.
Spectra Detect Worker
The “Download logs” button allows the user to download a support archive containing relevant system logs from the Worker. The contents of the support archive downloaded in this way are identical to the contents of the archive generated by running the tiscale-support command directly on the Worker instance.
Spectra Detect Hub
For Hubs that are configured as a Hub group (redundancy cluster), the appliance status page contains additional information above the tabs.
The link Redundant with <other Hub instance> allows users to quickly access the other Hub instance in the cluster, and view its status page.
Editing and Removing Appliances
To edit an appliance, click on its row in the Dashboard to access the appliance status page. Click Edit to open the Configure appliance dialog.
Here the name, host name, URL, and the SNMP (Simple Network Management Protocol) community string of the appliance can be modified. The HTTPS protocol is mandatory for the appliance URL. For Spectra Detect Hub appliances, it’s also possible to provide the HAProxy password to enable HAProxy monitoring.
Click Save to save changes, or Cancel to return to the appliance status page without saving.
To remove an appliance, click Remove on the appliance status page. Confirm the removal in the popup dialog that appears at the top of the page.
To safely remove an appliance, always use the Remove option on the appliance status page when the appliance is online. Attempting to remove or replace an appliance by changing its URL, or removing it while it is offline will result in an error.
Appliances periodically check whether they are still connected to the Manager. If an appliance is removed improperly, the Manager will detect it, and the appliance will be automatically removed from the Manager.